The Lead Hypothesis
Note: What follows is the (lightly edited) transcript of a presentation I gave to Effective Altruism Chicago earlier this month.
I had my first contact with the lead hypothesis almost three years ago. I was attending a talk by Troy Hernandez, data scientist and leader of the Pilsen Environmental Rights and Reform Organization (PERRO), about the health risks associated with Chicago’s water main replacement plan. Troy painted a compelling (and frightening) picture of lead poisoning in Pilsen, and detailed the neighborhood’s historical struggles for environmental justice, and I was inspired.
Since then, PERRO and my company JustDesign have collaborated on four lead-rated water filter distributions, and I’ve written a series of blog posts on my work developing a gadget to enable automatic pipe flushing, quantifying the extent of the harm caused by Chicago’s water main replacements, and mapping future water main construction projects across the city.
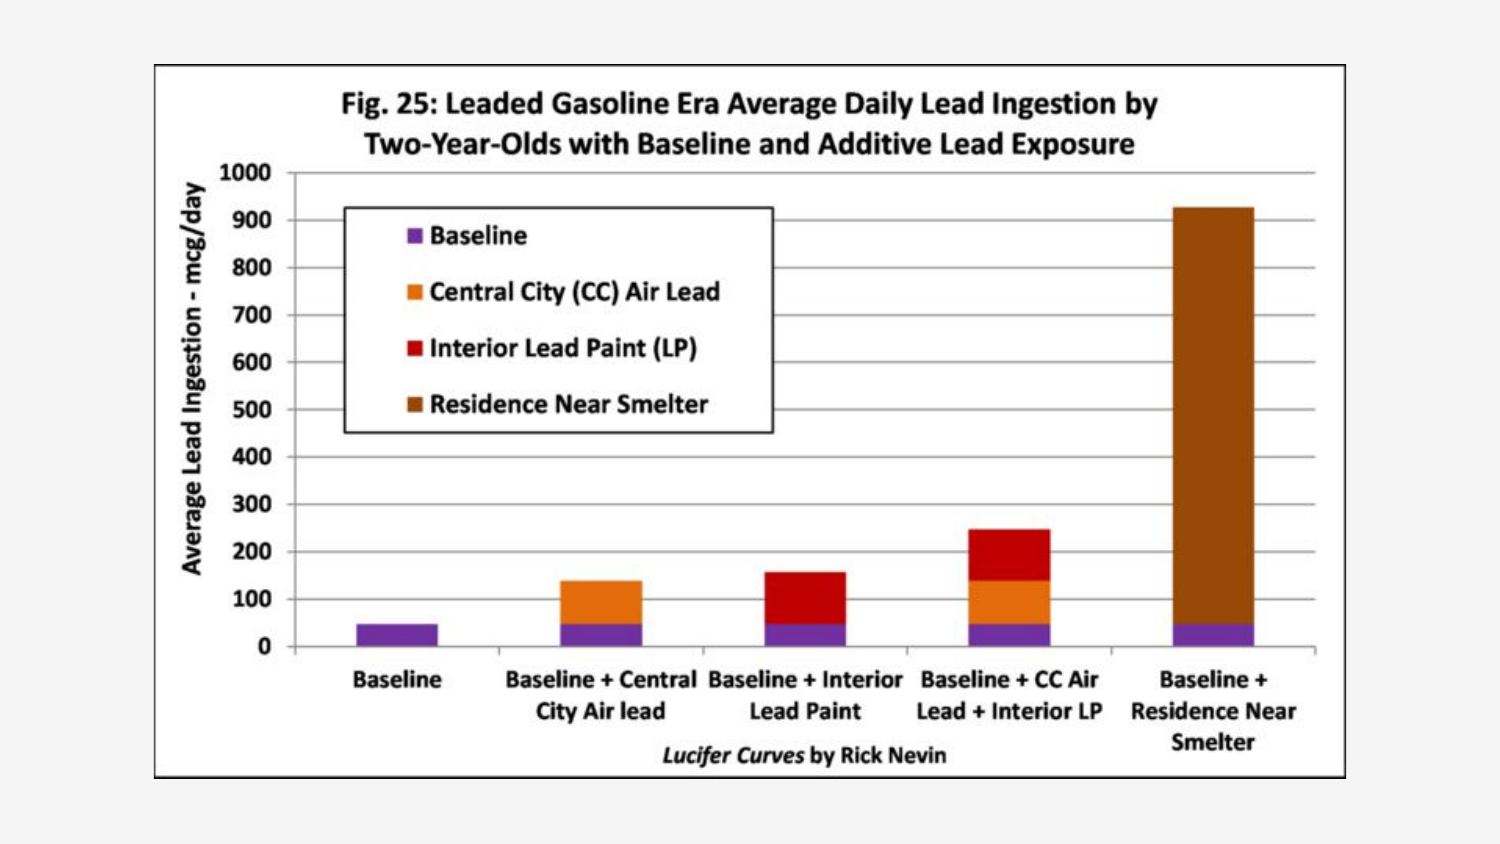
Throughout this process, I’ve been increasingly exposed to the full scale horror of lead poisoning, from attending Troy’s presentation to reading the alarming Lucifer Curves by Rick Nevin. For an aspiring effective altruist like myself, accepting even a portion of these claims has implications for cause prioritization, but the issue appears to have been neglected in the Effective Altruism (EA) literature thus far.
And so, with this post, I’ll explore lead poisoning through an EA lens, and make an argument for its consideration as a potential cause area.
- Introduction
- Background on lead
- Exposure risks
- Individual and societal harm
- Interventions and cost effectiveness
- Conclusion
- Organizations
Introduction
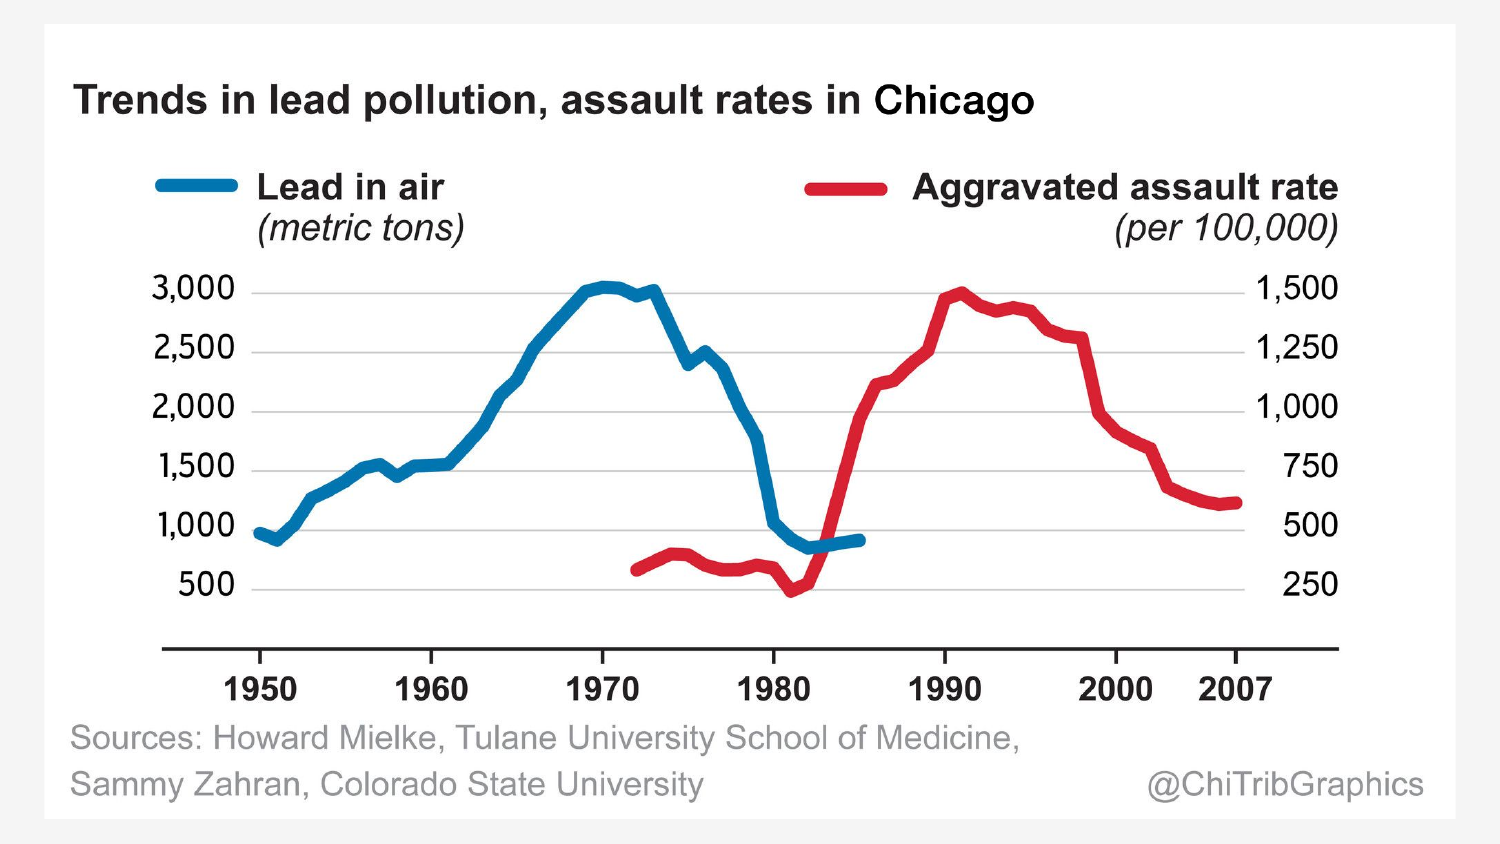
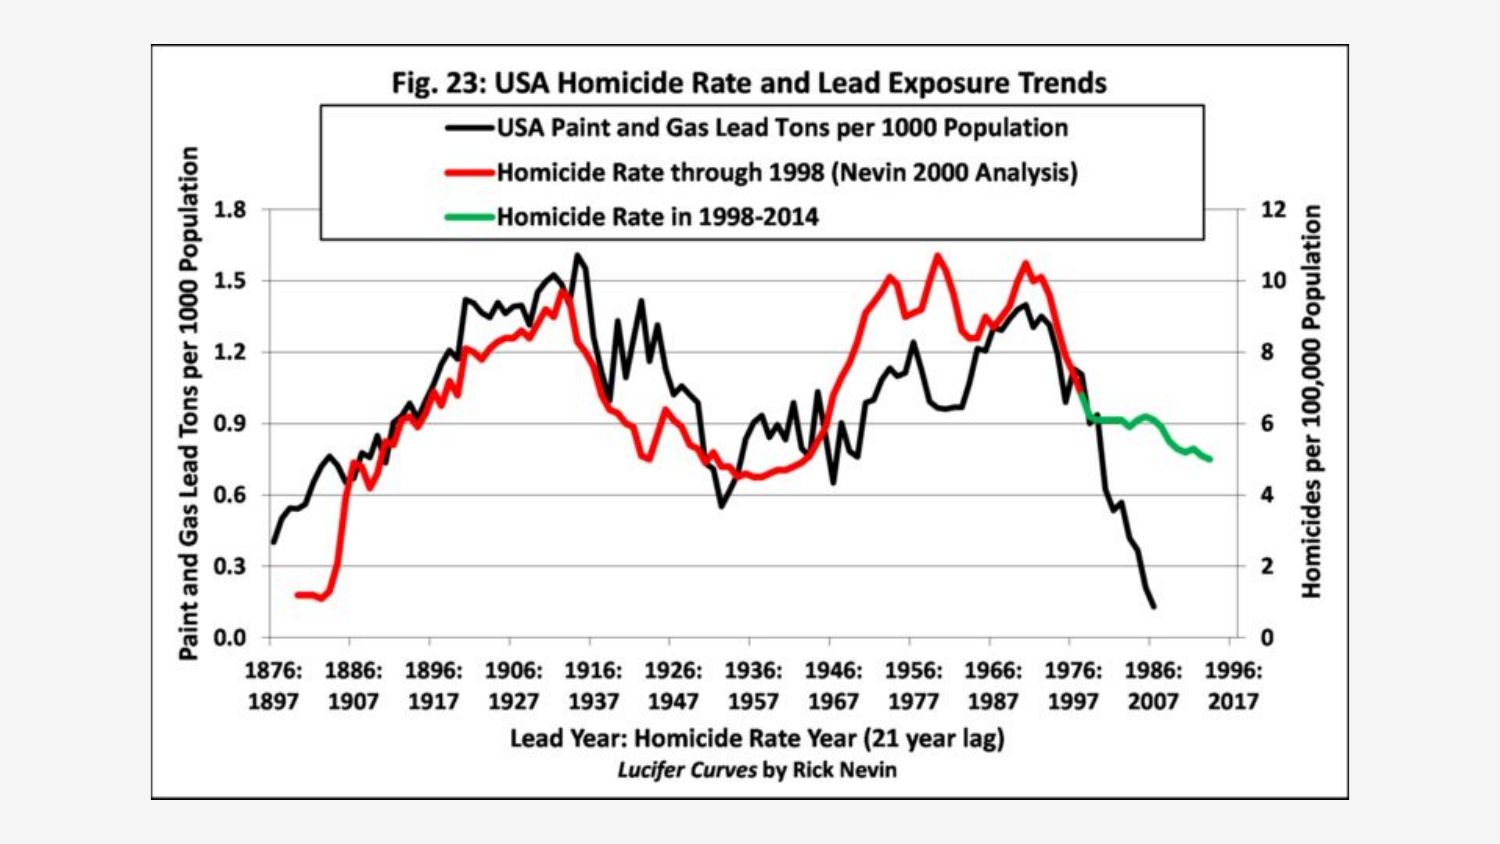
This graph is from a paper titled “The urban rise and fall of air lead (Pb) and the latent surge and retreat of societal violence”. I work part time in finance, doing data analysis for a hedge fund. I see a lot of big data sets, and it’s my job to mine small time-series correlations from them to inform novel trading strategies. I’m used to seeing data that is one step away from random noise, and so it’s hard to do justice to how impressive a graph like this is. When I first saw it, I couldn’t believe that a correlation (note, not necessarily causation!) like this existed, and that I didn’t know about it.
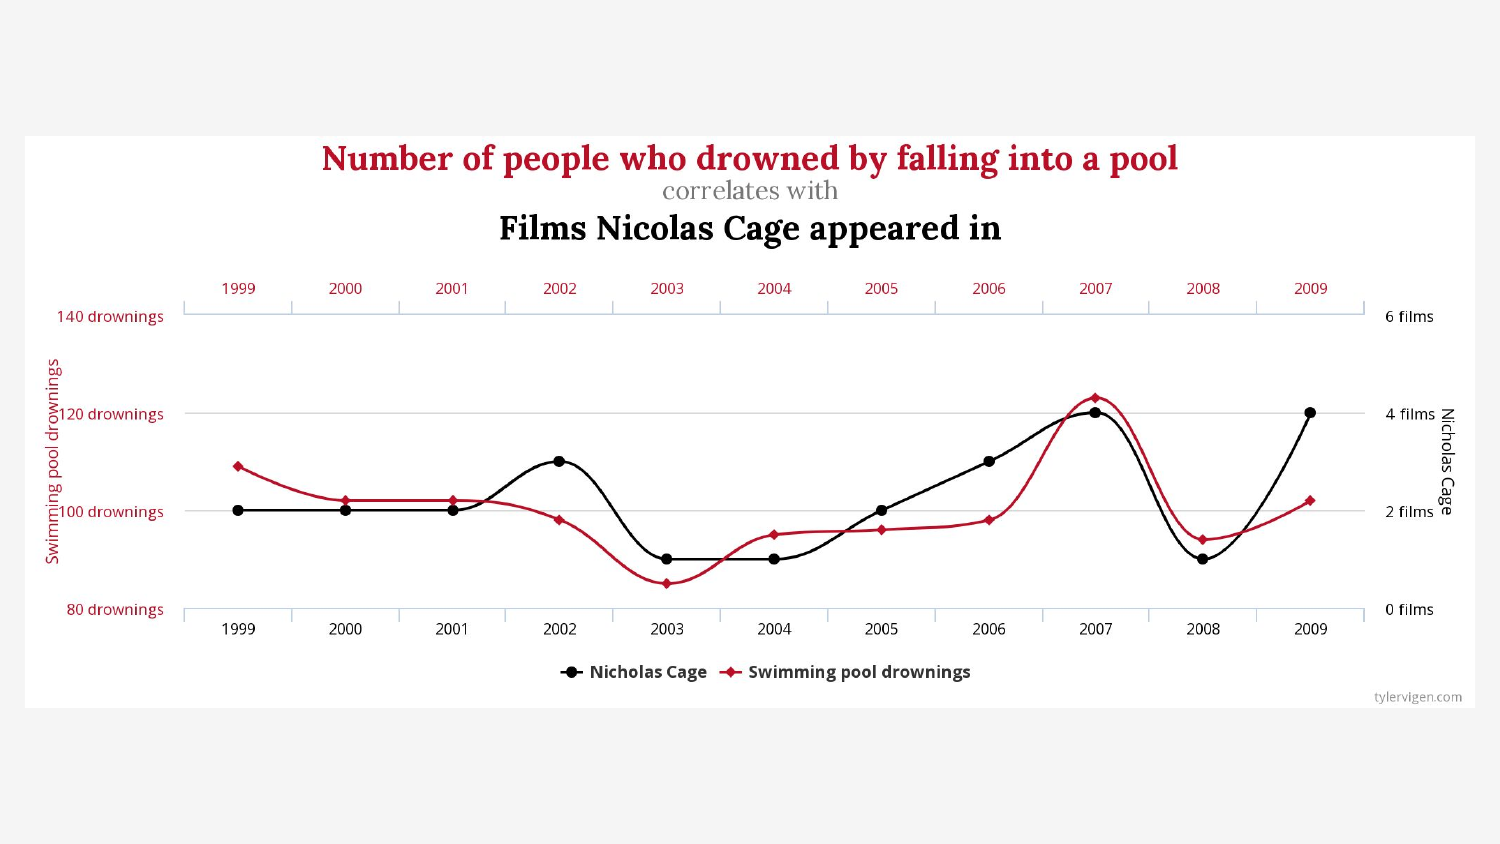
Correlation is a tricky thing, though. We live in a world of data, and spurious correlations abound, including this classic (whether or not Nicolas Cage should be an EA cause priority is a topic for another post):
Also problematic is the fact that, as a non-expert, I am going to make some equivalently wild claims, implying that lead poisoning is primarily, causally responsible for some of the most harmful societal trends of the 20th century. Should you believe me?
While working on this post, I’ve been following the recent Slate Star Codex series on Epistemic Learned Helplessness. Here’s a relevant quote from one of the articles, talking about Immanuel Velikovsky’s Ages in Chaos:
I read it and it seemed so obviously correct, so perfect, that I could barely bring myself to bother to search out rebuttals. And then I read the rebuttals, and they were so obviously correct, so devastating, that I couldn’t believe I had ever been so dumb as to believe Velikovsky. And then I read the rebuttals to the rebuttals, and they were so obviously correct that I felt silly for ever doubting.
Scott goes on to say that ignoring arguments “is the correct Bayesian action: if I know that a false argument sounds just as convincing as a true argument, argument convincingness provides no evidence either way. I should ignore it and stick with my prior.” This is something I tried to keep in mind when putting together this post, and I encourage you to do the same.
Clearly it’s going to take more than just arguments to establish that the above graph is causal, not merely a terrifying coincidence. Since the use of randomized control trials, the gold standard in scientific literature, is obviously unethical in the context of childhood lead poisoning, we’ll have to ascertain implicit causation via other means. Along those lines, here are some questions to consider as we explore the evidence:
- Does exposure to environmental lead cause measurable biological damage?
- Is there a dose-response relationship?
- Does this biological damage plausibly lead to negative individual or societal outcomes?
- Does more damage lead to even worse outcomes?
- Are there natural experiments happening due to varying regulations in different locations?
- Do interventions lead to a reduction in biological damage?
- Does reduced damage lead to fewer negative outcomes?
As you see more graphs like the above throughout this post, try to keep these questions in mind, and we’ll review the evidence for and against each at the end.
Background on lead
But before trying to answer those questions directly, let’s start with some basic background information:
- Lead is an element, with atomic number 82.
- It sits next to titanium and bismuth on the periodic table.
- There is lots of it in the Earth’s crust, especially for its large atomic weight.
- Most lead on earth was initially buried, but (unfortunately) it’s easily extracted from ore.
- Galena, which also contains silver, is the most important sources.
- Lead has several notable characteristics. It is:
- relatively inert, and can be used in the presence of reactive chemicals,
- high density, making it useful for radiation shielding, from X-Rays to Chernobyl,
- remarkably ductile, which comes in handy for plumbing,
- and has a low melting point, important for soldering applications.
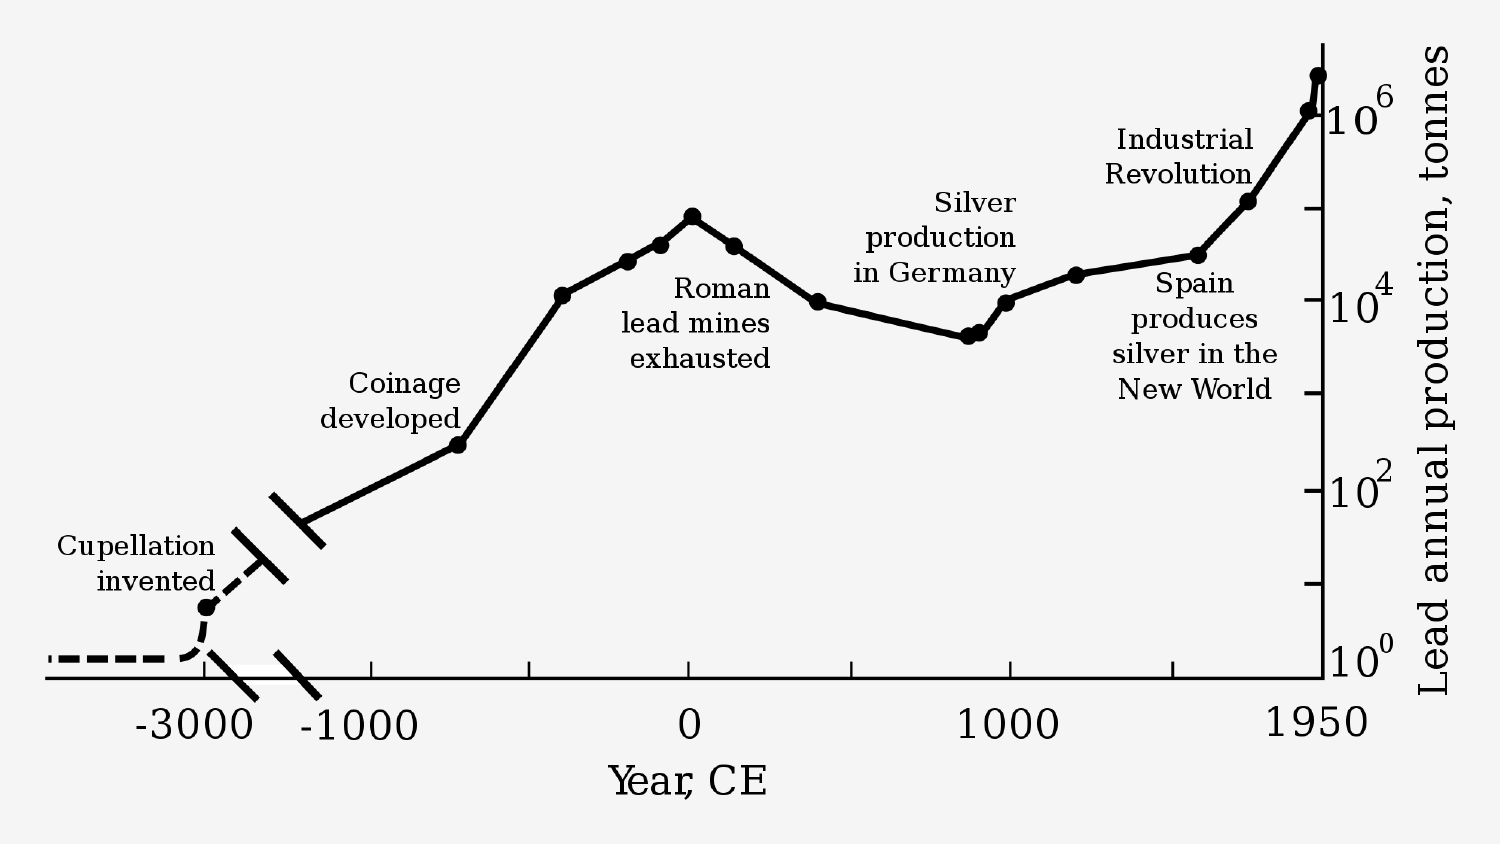
Because of this unique combination of characteristics, lead has been present throughout human history, perhaps most notoriously in Rome, where it was used to line the aqueducts, baths, vats and cooking pots, and even as a sweetener for wine. Even the periodic symbol Pb even comes from the Latin word for lead, plumbum, and so it’s unsurprising that Romans were the first to correlate lead with its harmful side-effects in the second century BCE (though if it’s unlikely to have been a proximal cause behind the fall).
Lead continued to find applications throughout the middle ages, including alchemy, wine preservation, the printing press, and bullets (the combination of which makes the middle ages sound kind of cool?), but wasn’t until the Industrial Revolution when it again reached Roman-levels of production, with the invention of lead paint.
The 20th century gave rise to modern uses of lead beyond plumbing and paint, most notably in the form of tetraethyllead (TEL), marketed as an antiknock additive for gasoline. The proliferation of leaded gasoline provides an interesting anecdote, worthy of a quick diversion.
The clean room
Like any good story, the history of lead poisoning is replete with heroes and villains (though unfortunately there are more of the latter). Clair Patterson is its first true hero, right down to his unlikely origin story.
After graduating from the University of Iowa with M.A. in molecular spectroscopy, and working on the Manhattan Project in WWII, Patterson joined the University of Chicago’s geochemistry program under renowned scientist Harrison Brown. For his dissertation project, Brown directed him to use mass spectrometry and uranium dating to try to form a more accurate estimate of the age of the earth.
Uranium has a unique half life (the time during which half of an original substance will disappear, in this case forming constituent components like lead) of 4.5 billion years, making it ideal for studying events on a geological timescale. When the solar system formed, the entire quantity of nearby Uranium-238 was simultaneously created, and has been slowly transforming into lead ever since.
Although much of the original surface of the earth has been buried due to plate tectonics, meteorites (such as the one that impacted in Canyon Diablo in Arizona, pictured above) still contain undisturbed samples of this original uranium within zircon crystals. Because these crystals strongly reject lead when forming, knowing the current ratio of uranium to lead atoms is enough to probabilistically determine the age of the earth.
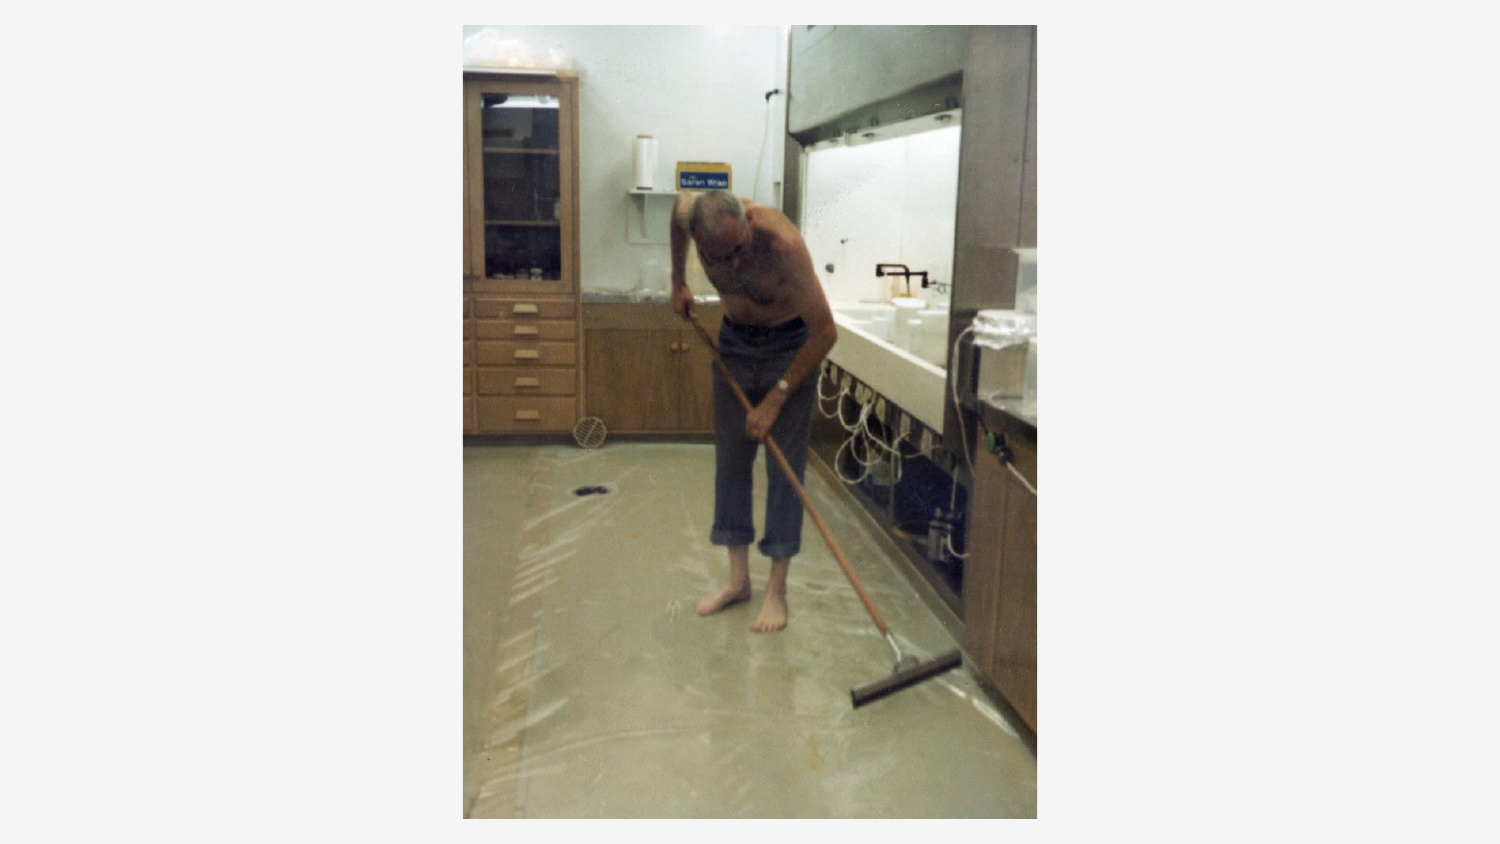
This was Patterson’s task, though as he quickly discovered, it was not an easy one. While trying to calibrate his system against previously dated zircon crystals, he measured lead concentrations that were orders of magnitude higher than expected. After laboriously confirming these results, Patterson began to suspect that atmospheric lead was contaminating his samples, and developed sterilization procedures that would result in the first true “clean room” facility.
What Patterson didn’t know at the time was that the concentration of atmospheric lead was at its highest point in human history, and still rising, primarily due to the work of (villain #1) Charles Kettering.
Kettering, a brilliant inventor and the honorary namesake of Kettering University in Michigan, has the unfortunate distinction of having invented some of the most harmful technologies in the 20th century, including Freon (the CFC most responsible for the early-90s hole in the ozone layer), the Kettering Bug (the first aerial missile, which helped spur the development of guided missiles), and most relevant to Patterson’s work, the TEL antiknock additive, which had become ubiquitous since its release the 1920s.
Patterson’s research was eventually successful, but only after he moved from Chicago to Cal Tech in Pasadena, where he was given the opportunity to build a truly isolated laboratory environment for his measurements. By this time, however, he had grown so concerned about atmospheric lead that he would spend the remainder of his career attempting to bring awareness to the issue.
It was at about the same time that the first modern reports of lead poisoning were getting widespread attention. Workers in TEL plants across the country were developing similar forms of mental illness, or even dying in some cases, presumably from exposure to lead in high concentrations. Given his experience with ubiquitous lead contamination, Patterson was troubled by the implications, but like most of his contemporaries, he assumed that there was some baseline, safe level of lead in the atmosphere prior to the spread of TEL.
However, as he began measuring lead levels in far flung locations, from the bottom of the ocean, to ice sheets in Greenland and Antarctica, he discovered that the further he got from modern civilization, the lower the concentration of atmospheric levels, approaching an apparent baseline of nearly zero. To Patterson this discovery implied the potential for mass poisoning on an unprecedented scale.
His attempts to alert policymakers were predictably opposed by the oil industry, who, after unsuccessfully attempting to get him fired, instead hired Robert Kehoe (villain #2, pictured above) to serve as their own scientific expert. Kehoe notoriously used questionable scientific research methods to advocate for lead’s safety, and confidently dismissed Patterson’s claims “laughable”.
Kehoe and Patterson would have a famous showdown in front a Senate Committee chaired by Maine Senator Edmund Muskie, an early champion of environmental causes, with Patterson using his research to presciently contradict Kehoe’s claim that there was a safe threshold for lead exposure. Though his advocacy didn’t immediately have the desired effect, Patterson is credited in large part with the EPA regulations that would finally phase TEL out of gasoline by the end of 1995.
Childhood blood lead levels (BLLs) increased dramatically in the early 20th century, primarily due to TEL emissions, but other factors contributed as well.
Exposure risks
Although many of the worst contaminates are no longer actively produced, the CDC estimates that 1.5 million children are exposed to harmful levels of lead each year. This is not surprising, given that the United States, despite the known health risks, still consumes more than a million of tons of lead annually. When a child presents with elevated BLLs, the CDC recommends that health care practitioners work to identify all possible lead sources in their environment, and what follows is a summary of the most common pathways to exposure.
Diet
Perhaps the most direct pathway is through the unintentional consumption of lead in everyday food items, which accounts for up to 4 µg per day on average. Lead is found in many typical foods, but most prominently in chocolate, for manufacturing reasons that go beyond a single source. More bad news for people who enjoy sweets: candy, especially products imported from Mexico, have been repeatedly found to contain high lead levels, typically due to wrappers printed with lead ink.
Lead is also passed to food and drink through the use of kitchen products, such as leaded crystal (which can release high amounts of lead even when in contact with a liquid for a short time), or ceramic plates and bowls containing lead glaze. Even plastic bread bags have been found to contain lead ink, which can leach if the bags are reused for storage of acidic foods.
Lead is ubiquitous in dietary supplements, with one analysis finding close to 25% contain more than the recommended daily safe dietary intake. This made local news in 2016, when the supplement DHZC-2 was implicated in the death of two adults and the poisoning of two children in Chicago.
Finally, lead in breast milk, which is correlated with the mother’s current BLL and history of exposure, can be passed to infants during periods of critical development. Thankfully, calcium supplementation has been shown to reduce lead in breast milk, at least for women with low dietary calcium.
Dust
Although dust is typically a secondary source, it represents the main vector by which young children become lead poisoned, and dust levels in a home are the best predictor of childhood BLL. This is primarily due to infant hand-to-mouth behaviors, which cause the ingestion of lead dust from a variety of sources.
Besides dust from paint chips and contaminated soil, other sources include the salts used to stabilize PVCs, found in vinyl miniblinds and artificial Christmas trees, both of which degrade and form dangerous levels of lead dust through years of normal use. Also notable is the rubber infill in artificial turf on athletic fields, which is manufactured from recycled tires sometimes containing lead.
Lead dust in the home may also stem from occupational hazards. A meta-analysis found that children of lead-exposed workers had double the mean BLLs compared to the general population, and were 20 times more likely to suffer BLLs of more than 20 µg/dL. Construction workers, painters, plumbers, electricians, and other laborers may all have significant daily contact with products containing lead.
Soil
While soil naturally contains only trace amounts of lead, it has collected the historical fallout from nearby pollution, including high-traffic roads and mining/smelting sites. The problem is normally localized, but is widespread enough that, in 2004, soil represented the most common exposure source in Arizona for children with elevated BLLs.
One example frequently cited in the literature is the Robert Taylor Homes, which bordered the Dan Ryan expressway, Chicago’s main traffic corridor. Soil found in similar high-traffic, dense urban housing can average up to can average 1000 µg/g, enough to raise BLLs 5 µg/dL.
Smelting sites can also put children at risk of elevated BLLs through soil contamination, even up to 20 years after they are closed. In another example from Chicago’s south side, activism from PERRO led the EPA to hold smelter H. Kramer & Co. responsible for the cleanup of dozens lead-contaminated properties in the surrounding residential area.
Air and gasoline
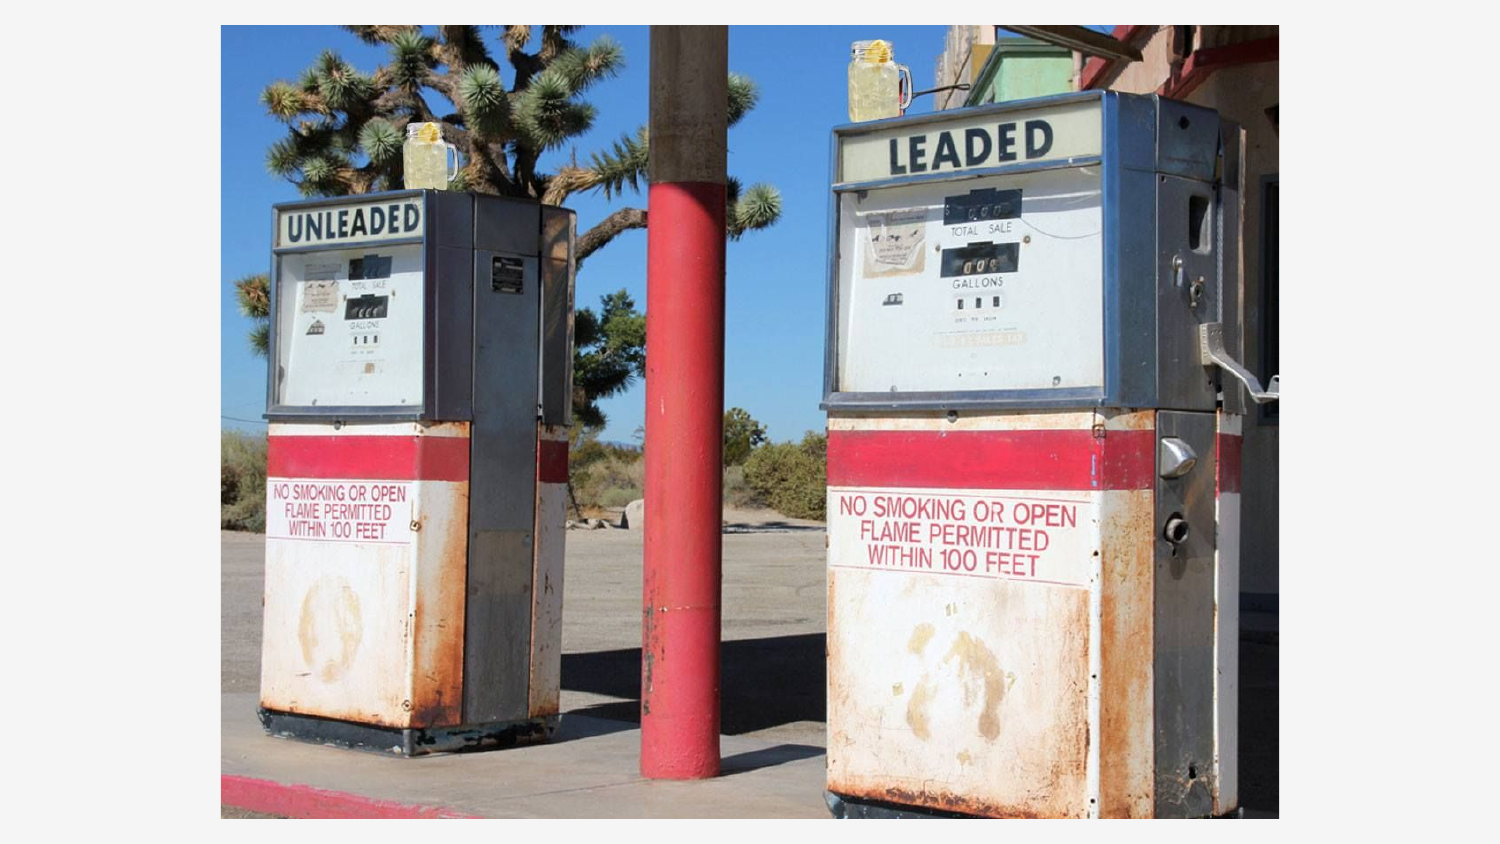
From its invention in the 1920s to its eventual phase-out in the mid 90s, TEL represented the most significant source of airbonre lead contamination in the US, but it was not just a domestic problem. As Nevin states in his in his 2007 paper “Understanding international crime trends: The legacy of preschool lead exposure”:
National trends in average blood lead and the use of lead in gasoline were highly correlated, with median R2 of 0.94 in Greece, Spain, South Africa, Venezuela, Belgium, Sweden, Mexico, Finland, Canada, New Zealand, Italy, Switzerland, Britain and the USA.
Since TEL was banned, industrial sources have taken its place as the leading source of airbonre lead, accounting for nearly 80% of total emissions. Modeling by the EPA suggests that local industry is highly correlated with the BLLs of surrounding children, and after decades of decline, mean US air lead levels actually rose in the mid 2000s from industrial emissions.
Other sources of emissions include airplanes using leaded “avgas”, which have been shown to increase lead concentrations in the areas surrounding certain airports, and the demolition of old buildings, which can temporarily increase airbonre lead even as they remove exposure risks due to lead paint.
Paint
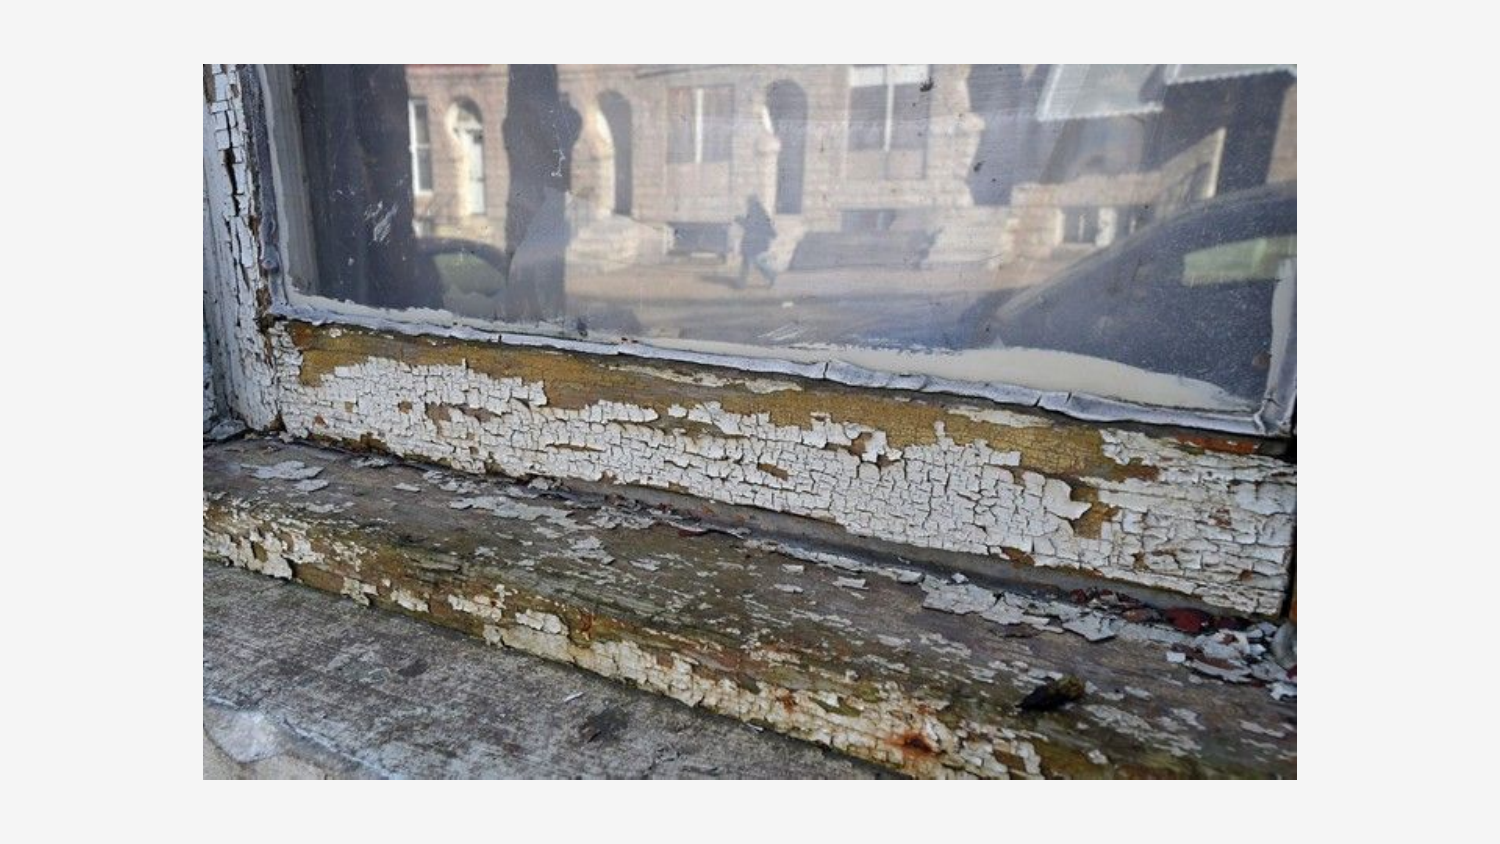
Aside from the middle 20th century (when TEL accounted for the largest exposure risk), lead paint has been the primary modern source for childhood lead poisoning. From its invention in the late 1800s up through a 1978 ban, white lead paint was a popular option for interior surfaces, consuming almost one third of total US lead production in the early 20th century. Worse yet, marketing campaigns often directly targeted children’s rooms, using characters like the Dutch Boy and his “lead family,” long after the safety hazards were known:
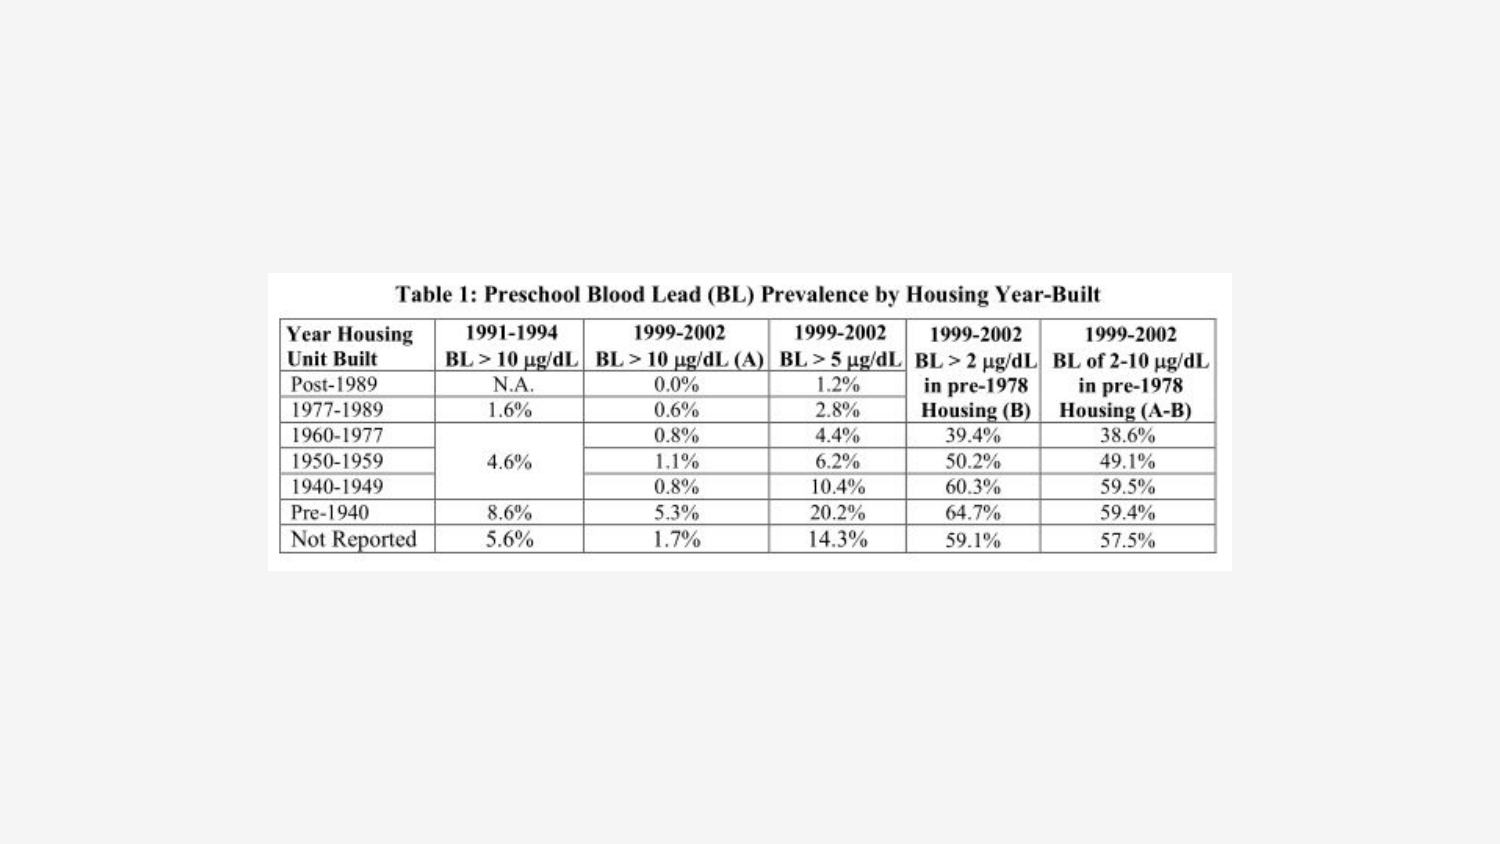
Exposure risks from lead paint persist today, with up to 38 million homes still containing lead paint as of 2000, 24 million of which were in a deteriorating condition. This is why lead paint and corresponding dust still account for up to 70% of elevated blood lead levels, including more than 5% of all preschool children living in housing built before 1950 (compared to just 0.4% in housing built after 1977).
While all housing built before the ban on lead paint should be considered a significant hazard, the distribution is uneven. Families with incomes below the poverty level, and especially those in the Northeast and Midwest (where white lead paint was most popular) are especially vulnerable, experiencing almost double the exposure risk.
One interesting exception is New York City, where an extensive slum clearance and an early lead paint ban in the 1960s resulted in significantly reduced BLLs:
Chicago, Detroit, Baltimore, Philadelphia, and St. Louis report 3–4% of children tested in 1998–1999 had blood lead over 20 µg/dL, but New York City prevalence over 20 µg/dL was just 0.4%.
Water
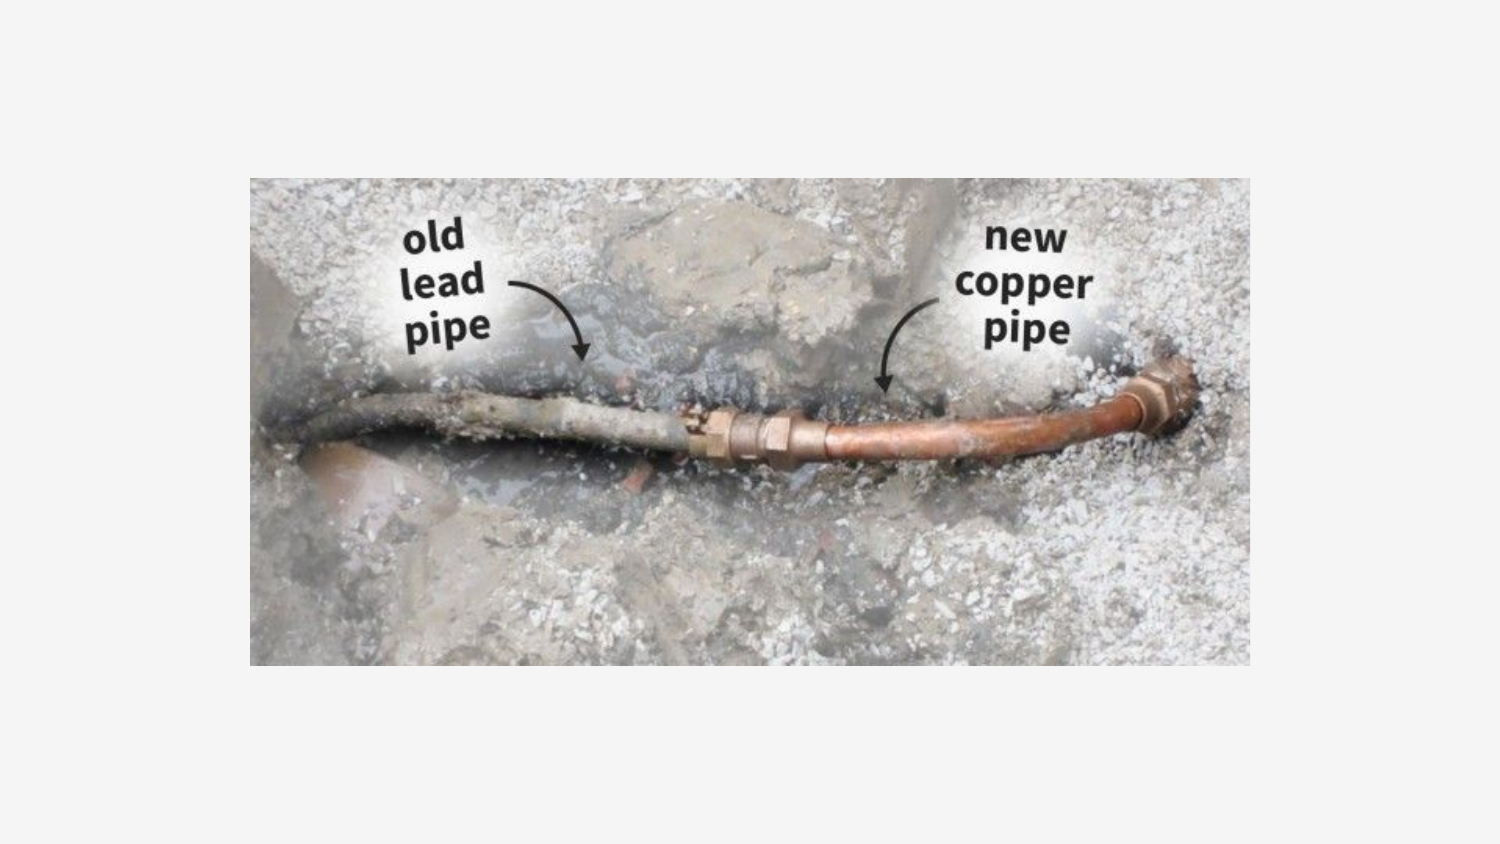
Lead in the water supply has been a known health risk since the Roman Empire, but unlike paint and gasoline (where technological innovation has supplied lead-free alternatives), plumbing is still inextricably tied to its namesake, and no federal ban on the use of lead pipes has yet been enacted.
Instead, a measurement-based approach is used to determine the lead hazard in the water supply, governed by EPA’s Lead and Copper Rule (LCR). This is a particularly bad approach for a number of reasons:
- The LCR mandates that at least 50 samples of tap water be measured at various locations around a municipality every three years, but does not adequately specify the distribution of these measurements, creating a perverse incentive for local authorities to concentrate sampling in areas where water quality is known to be below the 15 ppb limit.
- The 15 ppb limit itself is not a safe threshold, but is instead a “reasonable” target based on the number of municipalities that are likely to fail testing, and the EPA’s capacity to monitor their progress at current funding levels. Water levels in excess of 15 ppb are associated with a 14% increase in children with BLLs above 10 µg/dL.
- Water testing is an inherently probabilistic, and the recommended sampling procedure is likely to produce a fat-tailed distribution, since lead pipes flake off in chunks instead of continuously.
A driving factor here is cost. In Chicago alone, it would take an estimated $2 billon dollar investment to replace all the current LSLs. However, other cities like Milwaukee and Pittsburgh have devised innovative cost sharing solutions, sometimes even mandating that LSLs be replaced during adjacent construction such as water main repair.
As childhood lead exposure decreases from other sources like gasoline and paint, water becomes a more important exposure risk. The crisis in Flint is an interesting case study on the lurking dangers of LSLs, and a few years ago I had the opportunity to interview Laura Sullivan, (ironically) a professor at Kettering University and appointee to the Flint Water Inter-Agency Coordinating Committee.
Flint
Much like Chicago and other Midwestern cities, Flint was built during the peak use of LSLs, but up until 2013, the water supply was “well maintained” through the use of chemical additives like orthophosophate, a corrosion inhibitor which works by creating a protective film on the interior of lead pipes. Flint had a longstanding agreement to purchase this treated water from Detroit, but in the aftermath of the financial crisis, the two cities (led by governor appointed, interim emergency managers), could not come to an agreement over the continued use of Detroit’s supply.
Agitated by local business interests, Flint instead opted to join with bordering Genesee County in the formation of the Karegnondi Water Authority (KWA), which planned to build a new pipeline directly from Lake Huron to the surrounding area. One caveat to this deal was that, because a small section of the current pipeline from Detroit to Flint was to be reused by KWA, Flint would have to find an alternative water source for several years until construction was completed. In a fateful decision with lethal consequences, Flint management decided to tap local river water to meet this interim need.
Although Flint’s treatment plant had been “finishing” water imported from Detroit for decades, it was wholly unprepared to deal with the corrosive nature of the Flint river water. Beyond the damage to the lead pipes, which (hero #2) local pediatrician Mona Hanna-Attisha correlated with elevated BLLs in children across the city, the varied use of chlorine combined with the proliferation of abandoned homes led to an outbreak of Legionnaires disease, sickening 90 and killing a dozen.
Eventually Flint’s contaminated water supply attracted widespread media attention, thanks in no small part to the advocacy of local mother LeAnne Walters and Chicago-based EPA employee Miguel Del Toral (heroes #3 and #4), another hero of our story, who will feature again later in this post. But Flint still does not have access to safe drinking water five years later, and should serve as a cautionary tale for other cities like Chicago about the present danger of LSLs.
Individual and societal harm
While environmental lead levels have been declining since the mid-20th century, exposure risks still abound, especially for children and vulnerable populations. Exactly how bad is that?
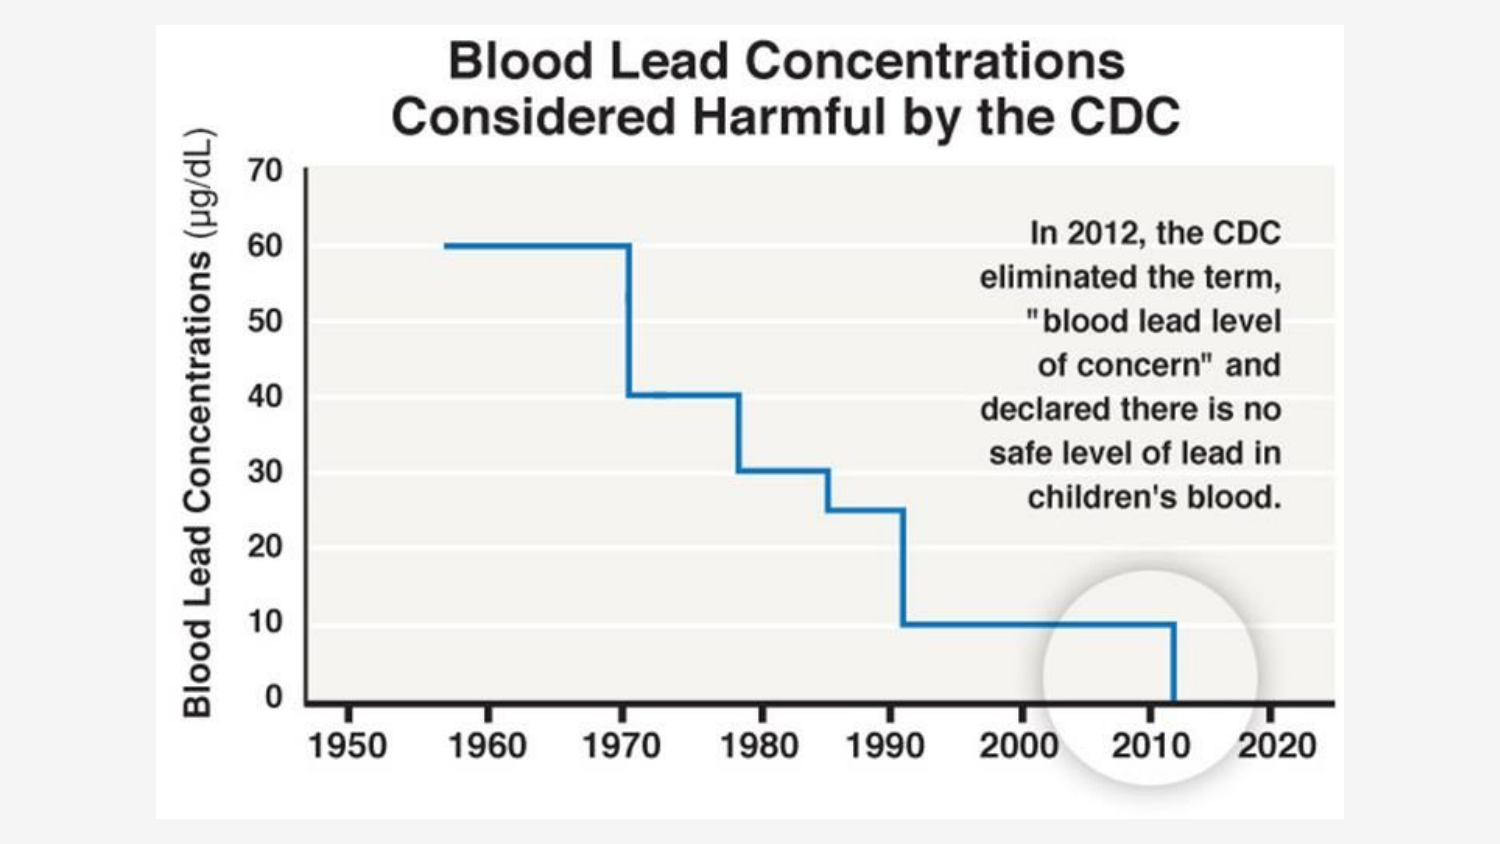
Lead is a known neurotoxin, and has cascading negative effects that impact both individual and societal health. Much of what we’ll discuss relates to “elevated” BLLs of 20 µg/dL or above, but studies have demonstrated long-lasting effects at levels as low as 1/5th that amount, and (as of 2012) the CDC explicitly states that “no safe blood lead level in children has been identified.”
Individual effects
Although, as the plight of workers in TEL plants demonstrates, lead exposure can harm adults, much of the research focuses on children and expectant mothers. There are several reasons for this, but they all revolve around a set of common themes.
First, children absorb lead more readily than adults, in part because they are growing at a faster rate, but also because of the way lead interacts the body on a cellular level. Our cells require minerals such as calcium, zinc, and iron to function properly, and lead interrupts this process by mimicking these metals, eventually leading to cellular death.
Second, children are more likely to be unintentionally exposed to household lead dust, especially around the age of 15-24 months, due to normal hand-to-mouth behaviors. As we discussed above, lead dust has a variety of sources, including paint, soil, and parental occupational exposure.
Finally, evidence suggests that lead exposure may cause permanent cognitive impairment during the critical stages of neural growth before the age of three. Symptoms of this damage include incomplete development of the blood brain barrier, and the destruction of frontal lobe myelin sheaths, which insulate white matter connections.
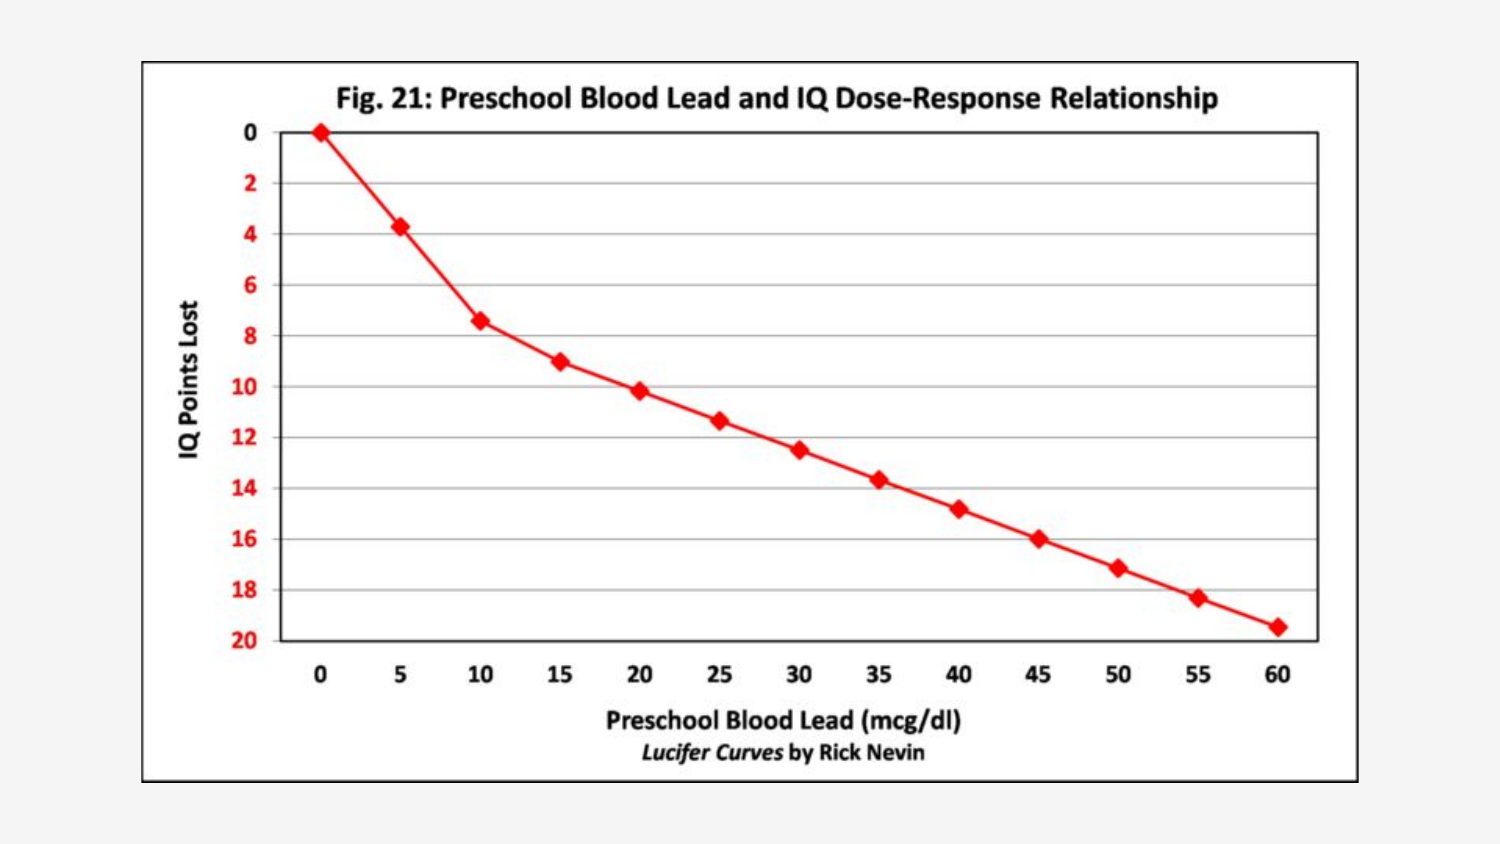
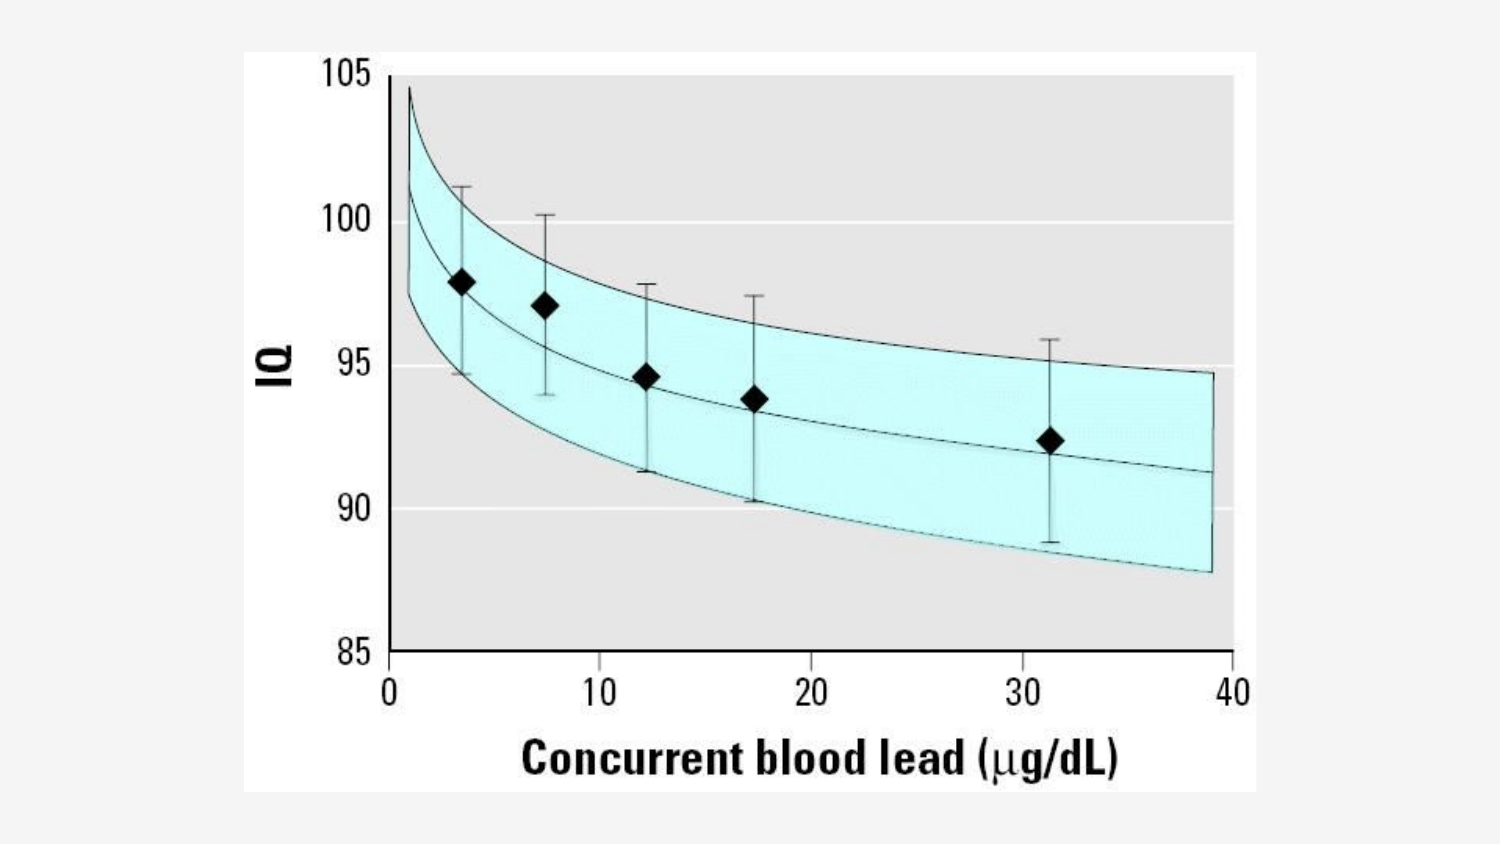
The correlation between increased BLLs and IQ loss (presumably as a result of this neurological damage) has been extensively studied, with different analyses producing results similar this graph from Lucifer Curves:
Especially noteworthy is the steep decline in IQ at low levels of exposure, which is critical to the importance of future interventions that target relatively small exposure risks.
These neural impairments also appear to have negative effects that go beyond just measured IQ, as behavioral problems throughout young adulthood, including ADHD diagnoses, are strongly correlated childhood lead exposure. While some studies describe these issues as an indirect effect of IQ loss (noting that low IQ youths are up to seven times more likely to be incarcerated than those with a high IQ), at least one study directly implicates the disruption of myelin formation with reduced impulse control in teens.
But to avoid painting too bleak a picture, it’s important to note that, while lead exposure can cause permanent damage, neurological effects may be reversible absent continuous exposure, as we’ll see in the next section on interventions. For now, Nevin reminds us that “in 1976-1980, 99.8% of all children ages 1-5 had blood lead above 5 µg/dL (and 88.2% had blood lead above 10 µg/dL)”, and the majority of them turned out just fine.
Violent crime
Even at a low risk of individual harm, however, the cumulative damage of lead poisoning has been enough to leave its mark on society as a whole.
Author's note:
The following several sections are based on Rick Nevin's work, which culminated in the publication of Lucifer Curves in 2016. His papers are as alarming as they are dense with citations, and don't lend themselves well to summary, but I'll do my best.
Also, in anticipation of any single-source criticism, see Stretesky and Lynch (2001) and Needleman et al. (2003) for two independent works that arrive at essentially the same conclusion.
In two seminal papers from the turn of the century, economist Rick Nevin sought to answer what was a perplexing question at the time. In the mid-90s, researchers at the US Bureau of Justice Statistics had projected an increase in teen murders (based on population grown and changes in demographics), but instead observed a historic 77% fall in the juvenile murder arrest rate through 2003. Moreover:
In 1991, the violent crime arrest rate for ages 10-14 was 2.3 times higher than the arrest rate for ages 50-54, but in 2014 the arrest rate for ages 10-14 was 35% lower than the arrest rate for ages 50-54. If brain function affects crime, then arrest rate trends by age suggest that brain function from 1991 to 2014 improved for youths but deteriorated for older adults. Why?
Nevin proposed a novel answer–the time-lagged effects of childhood lead poisoning–and he had the data to back it up.
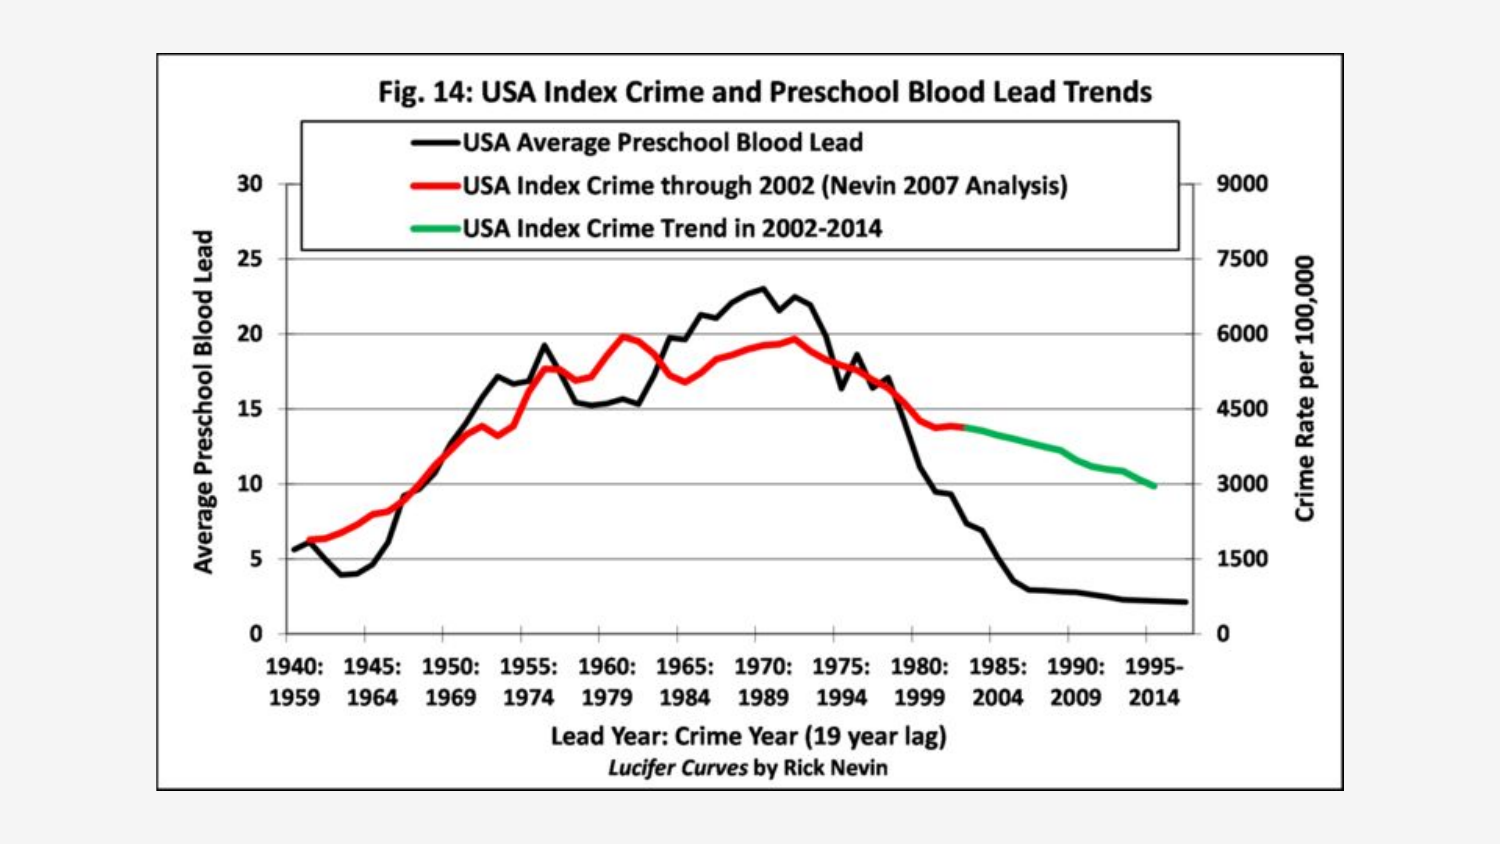
First, he demonstrated that the variables of interest were correlated. For childhood lead poisoning to be a plausible causal factor in future violent crimes, it’s necessary to show both the relationship between lead exposure and BLLs, and BLLs and violent crime. The graphs above and below demonstrate these two relationships, and the underlying data suggest that 90% of the variance of 1964-1998 violent crime in the USA can be explained by gasoline emissions between 1941-1975. As an example of this trend, Nevin explains that:
Youths ages 16–22 in 1994 were all born before the early-1980s fall in gasoline lead, and the age-16 arrest rate was 29% higher than the age-22 rate in 1994, consistent with criminal behavior being moderated by changes in frontal lobe development of adolescents and young adults. The 22-year-olds in 2001 were also born before the early-1980s decline in lead exposure, but the 16-year-olds were born in the mid-1980s, and the 2001 age-16 arrest rate was 12% lower than the age-22 arrest rate.
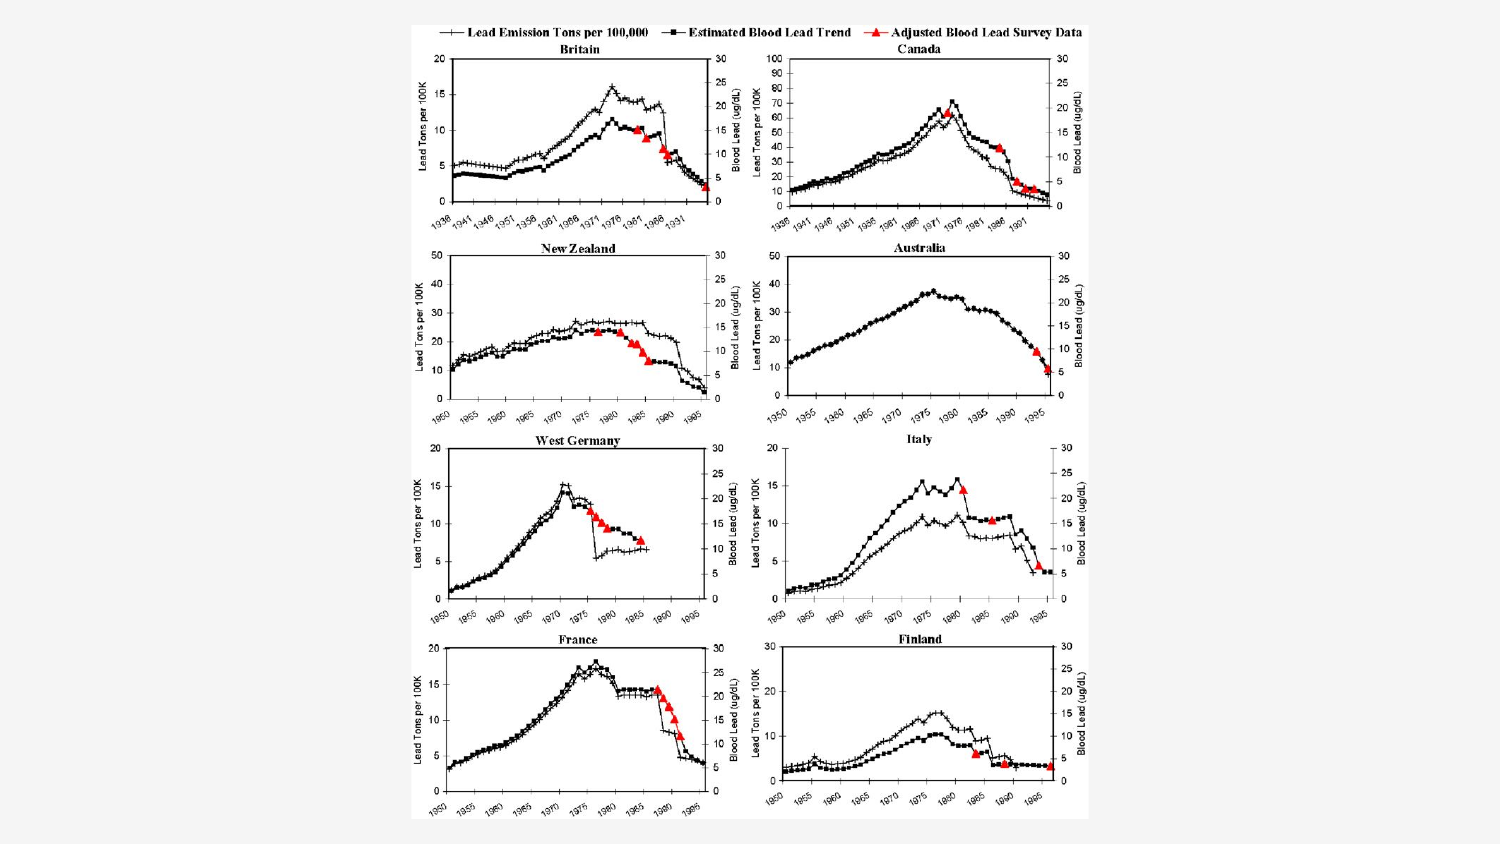
Next he extended these results with equivalent international data sets, showing that childhood BLLs tracked concurrent lead emissions across a diverse cross section of countries:
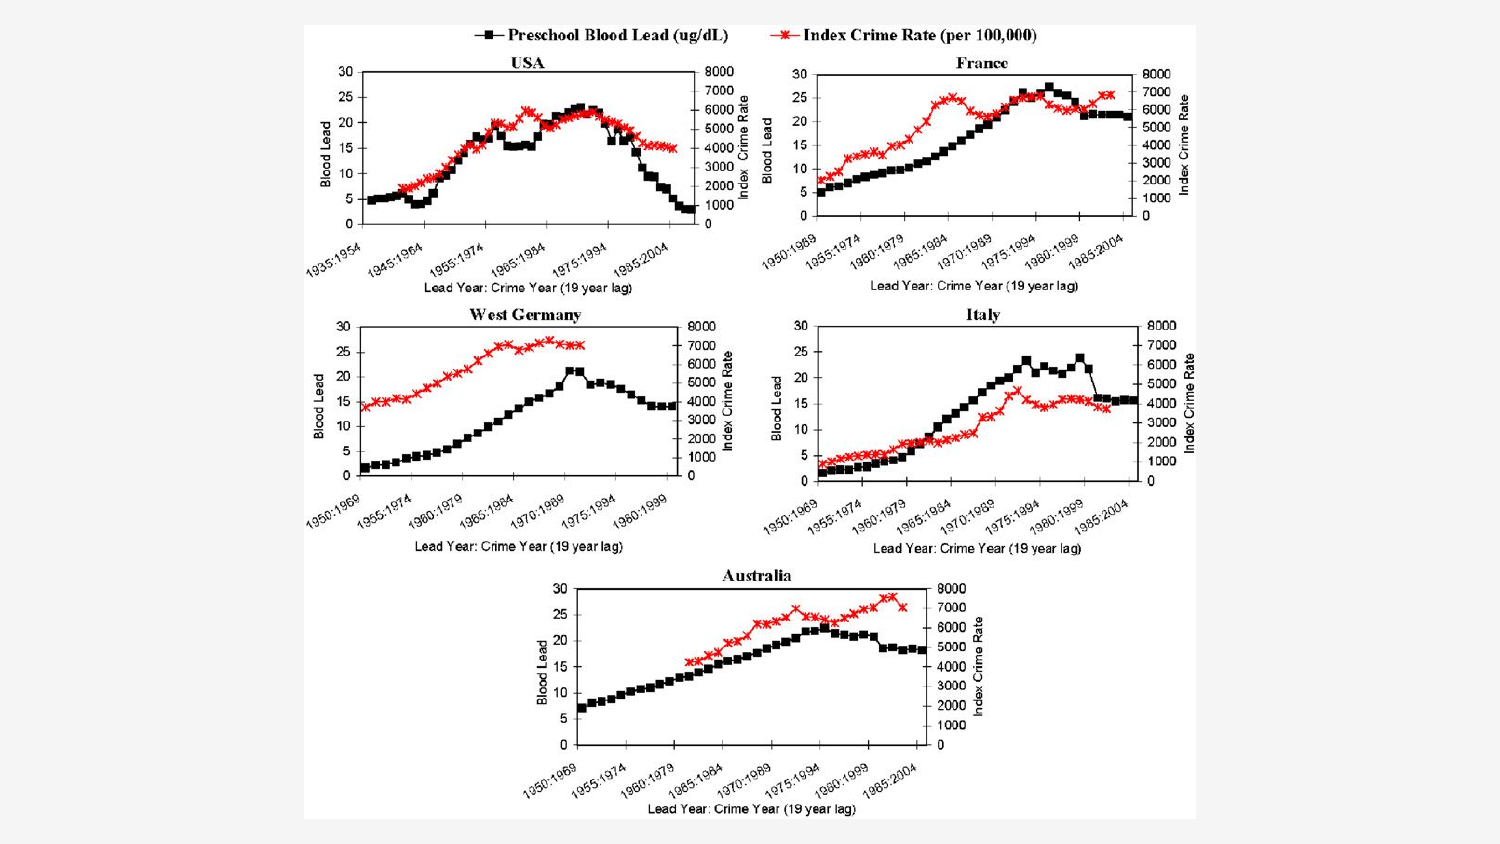
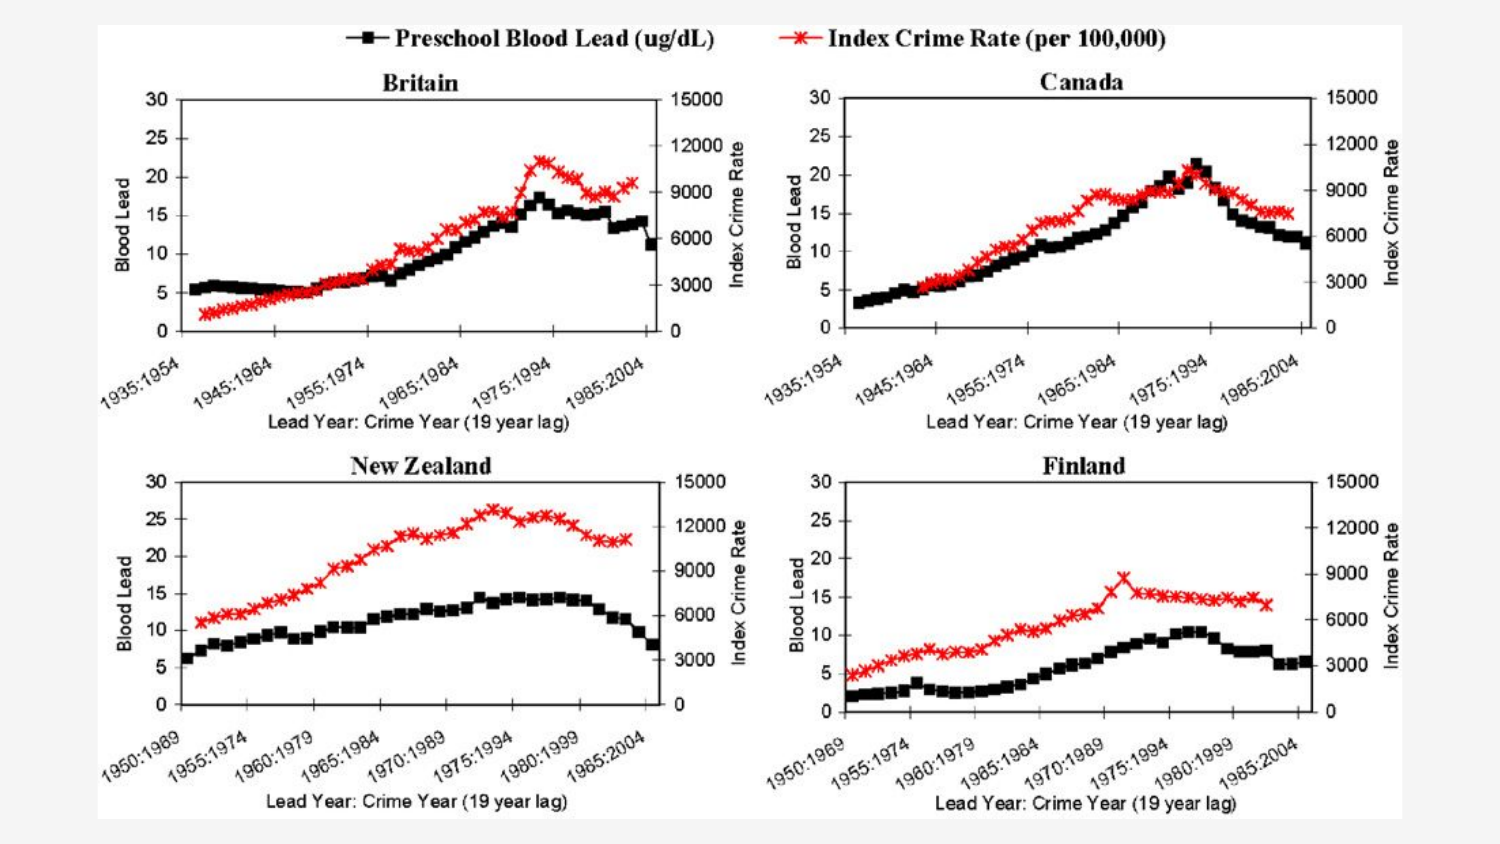
And also that index crime rates (as separately defined in each country) were strongly correlated with childhood BLLs at a 19 year lag:
What’s especially noteworthy about these results is that the various technological expansions and regulatory restrictions happened at different times in each country, yet the underlying relationship was common throughout! Nevin gives an example highlighting this disparity:
The very high significance of blood lead at lags consistent with peak offending ages is especially striking in light of divergent crime rate trends. Canada’s index crime rate was 60% higher than the rate in Britain in the early-1970s, but 20% lower in 2001.
Aside from the violent crime index in each country, Nevin also investigated burglary, robbery, and assault, concluding that “international crime trends are inconsistent with theoretical effects of police per capita, incarceration, and demographic trends,” but all results were consistent with lead poisoning as a causal factor. From this, he extrapolates:
The high R2 (63–93%) in each single-nation index crime regression with a 19-year lag also suggests that blood lead affects many types of criminal behavior including simple assaults and petty thefts.
Which is consistent with the expected repression of impulse control caused by neurological damage to myelin sheaths.
If you read enough of Nevin’s work, you begin to notice that he has a somewhat cavalier attitude when it comes time-series regressions. A proper analysis should probably have used a pre-registered value for the expected time lag, or split the country data into separate training and testing datasets, but instead Nevin followed a less rigorous procedure:
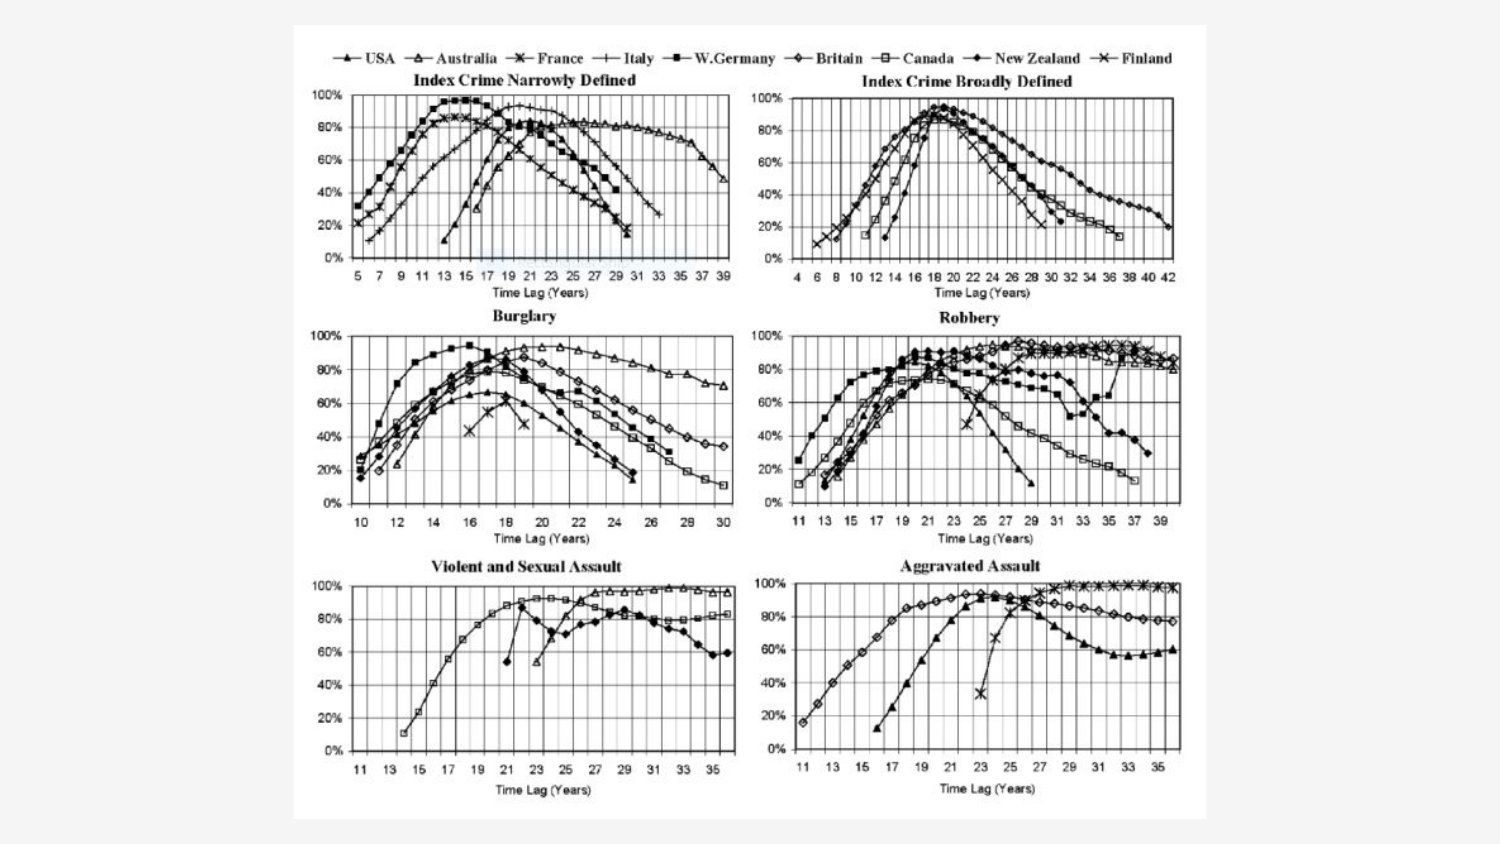
Single and combined nation regressions were run with 5–45 year lags to identify “best-fit” lags for each crime, with the highest significance (t-value) for blood lead and percent of crime rate variation explained (R2 ).
In other words, Nevin ran 41 experiments and presented the best results, or the same basic procedure responsible for p-hacking and the replication crisis in psychology. However, he makes a compelling argument that picking the optimal time lag is not essential for his conclusion, sharing the following graph demonstrating the variability of the international trends in each crime category:
He also directly addresses the possibility of spurious correlations, stating:
Although time series comparisons can result in coincidental correlations, no nation shows any correlation between burglary and blood lead at lags of less than 10 or over 38 years.
Taken as a whole, Nevin’s work strongly implies that either childhood lead poisoning or an equally powerful (and important!) set of confounders is primarily responsible for the bulk of crime in young adulthood.
Unwanted pregnancy and single parents
Nevin casually proceeds to use his lead hypothesis to tackle several additional, controversial social issues, beginning with abortion. Freakonomics authors Steven Levitt and Stephen J. Dubner famously claimed that the decline in crime in the 1990s was best explained by newly-legal abortion of unwanted pregnancies in the late 60s (as well as increasing incarceration rates).
Predictably, Nevin rejects this claim, providing evidence that declining crime in New York State did not track abortion legalization except in New York City, which experienced, you guessed it, a simultaneous decline in lead poisoning due to aforementioned slum clearance and a lead paint ban in the 60s. He also points out that:
Britain legalized abortion before the USA, but violent crime rose in Britain and across Europe and Oceana in the 1990s despite rising incarceration rates.
Next he turns his attention to single mothers, rejecting the conventional wisdom that the decline of two parent households was a causal factor for rising juvenile crime in the latter half of the 20th century:
That rise in juvenile offending coincided with a 1960s rise in the unwed teen birth rate, and the 1990s decline in juvenile arrests coincided with a falling unwed teen birth rate. Higher offending due to single parents would be consistent with juvenile offending that lagged the unwed birth trend by 12–17 years, as children raised by single mothers became teenagers. The coincident rise and fall of unwed birth rates and juvenile offending is inconsistent with the time precedence indicator of causation.
The evidence, as Nevin argues, suggests a different explanation for these societal trends:
Blood lead prevalence over 30 µg/dL among white USA children fell from 2% in 1976–1980 to less than 0.5% in 1988–1991, as prevalence over 30 µg/dL among black children plummeted from 12% to below 1%. The white juvenile murder arrest rate then fell from 6.4 to 2.1 from 1993–2003, as the black juvenile rate fell from 58.6 to 9.7. That 83% fall in the black juvenile murder arrest rate occurred with just 36% of black children living in two-parent families in 1993, and in 2003.
Inequality, race, IQ, and The Bell Curve
Finally, Nevin extends his hypothesis to dispute the findings of perhaps the most notorious book of the preceding decade: The Bell Curve. Published in 1994, authors Richard Herrnstein and Charles Murray analyzed IQ score distributions across various biological and social factors, concluding that there were meaningful genetic differences in intelligence between races.
Nevin analyzed the same data, but arrived at a very different conclusion. He began by showing that, because of the prominence of airborne lead contamination in the 1950s and 60s (affecting the same cohort studied in The Bell Curve), children living in city areas with urban traffic congestion experienced greater levels of lead exposure, since the majority of the lead dust settles within approximately 10 miles of auto emissions.
He again gives the example of the Robert Taylor Homes in Chicago, which bordered the Dan Ryan expressway, and absorbed the fallout from 150,000 vehicles/day worth of lead exhaust. Nearly two decades after they opened, the predominantly minority residents experienced 11% of Chicago’s total murders, despite only accounting for 0.5% of the total population. From this and other examples, Nevin infers that:
Preschool lead exposure is highly correlated with social factors because poor children are more likely to live in older housing with deteriorated paint, and black children were concentrated in cities with higher air lead.
Not only were children living in cities at risk for higher average BLLs, but 25% of city children screened in 1970 had BLLs in excess of 40 µg/dL. Nevin goes on to observe that this trend continued beyond the scope of data considered in The Bell Curve, drawing from his earlier analysis of violent crime to show that:
A stronger association between severe lead poisoning and violence is also consistent with racial differences in late-1970s blood lead and early-1990s juvenile arrest rates. Average 1976–1980 blood lead for black children ages 6–36 months was 50% above the average for white children, but blacks were six times more likely to have blood lead of 30–39 µg/dL and eight times more likely to be over 40 µg/dL.
Nevin concludes that racial disparities in IQ, which The Bell Curve attributes in part to genetic predisposition, can be better explained by housing inequality, and the corresponding differences in exposure to environmental lead.
Inequitable environmental factors persist even today, with children living in the 10 largest US cities in the early 2000s accounting for nearly half of elevated blood lead levels nationwide, despite representing less than 10% of the population. And disparity exists even within cities, with 50% of the children with EBLs concentrated in only 11% of local ZIP codes.
But there is also evidence to suggest that these trends are slowly reversing. Even in the middle of national decline in violent crime, the mid-90s ban on leaded gasoline equalized murder rates across all but the smallest cities:
From 1981–1991, USA murder rates rose 3% in cities of 100–500 thousand, 9% in cities of 500,000 to 1 million, and 26% in cities over a million. The 1980s phase-out of gas lead left little air lead difference by city size, and average 2000–2002 murder rates were 14.7 (per 100,000) in cities over a million, 14.6 in cities of 500,000 to a million, 15.0 in cities of 250–500 thousand, and 9.5 in cities of 100–250 thousand.
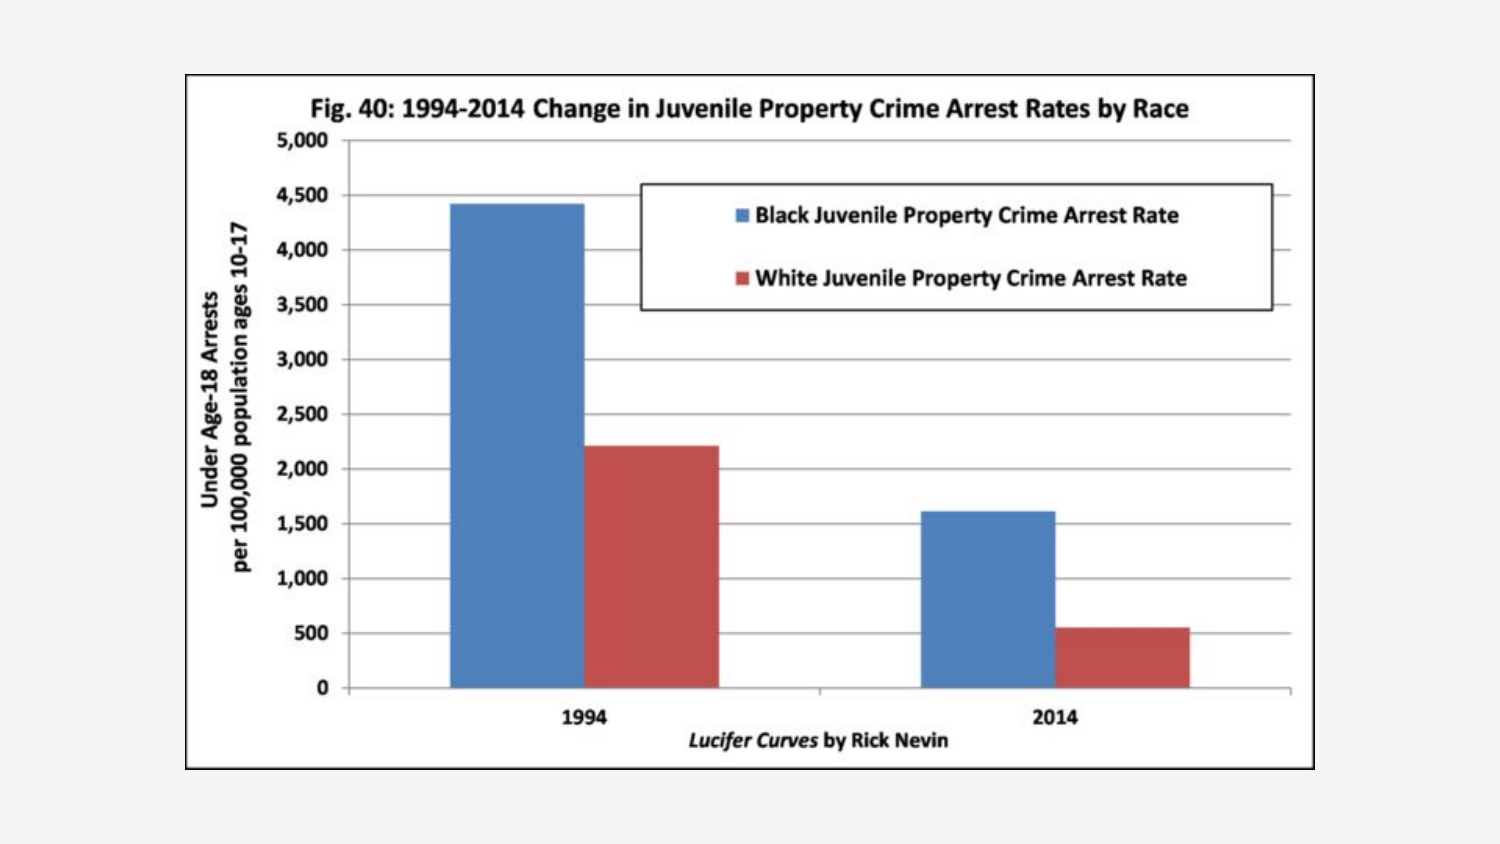
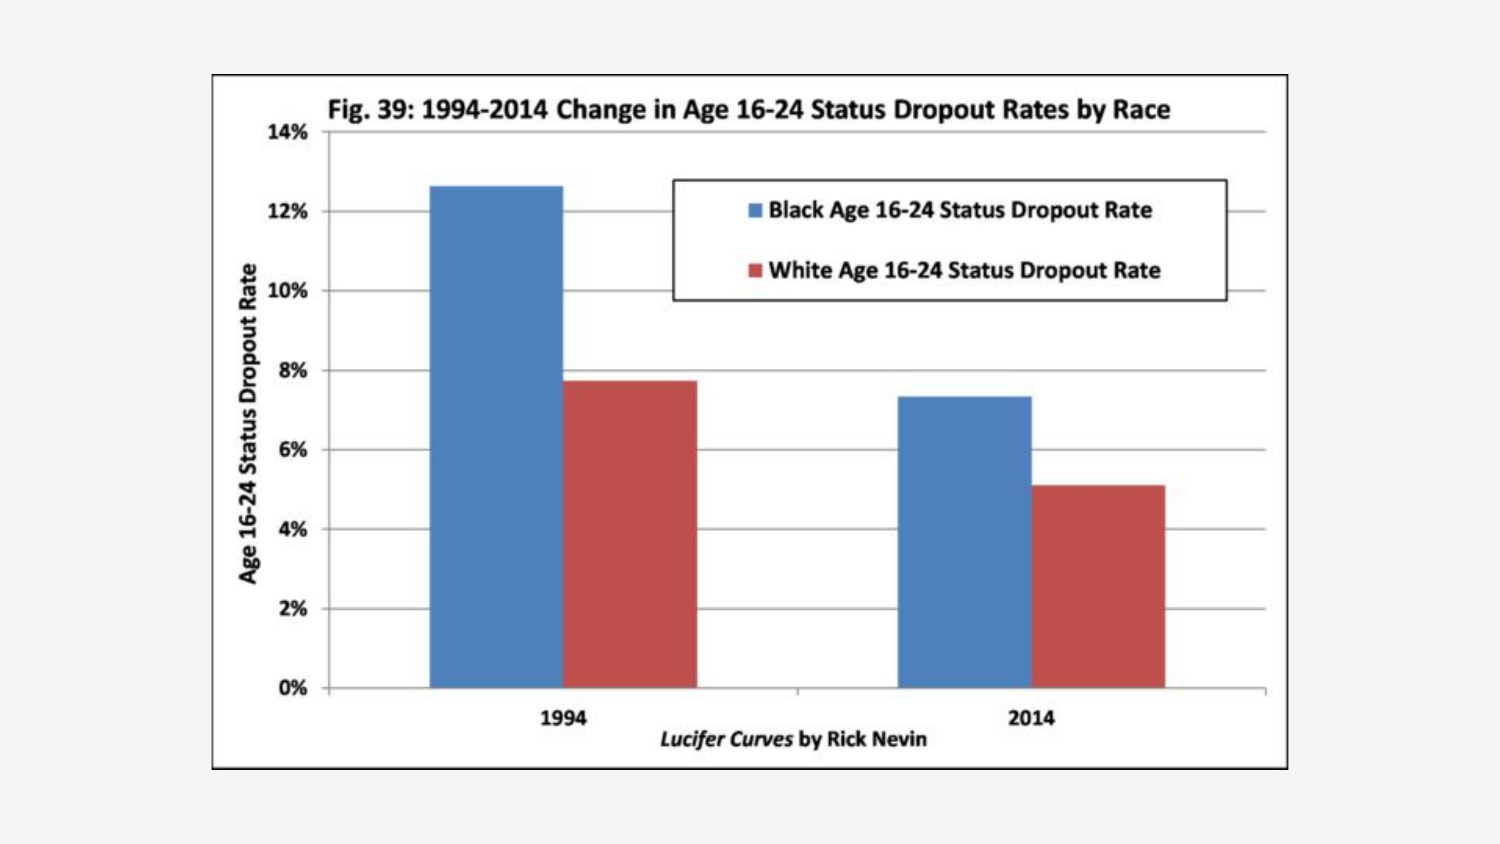
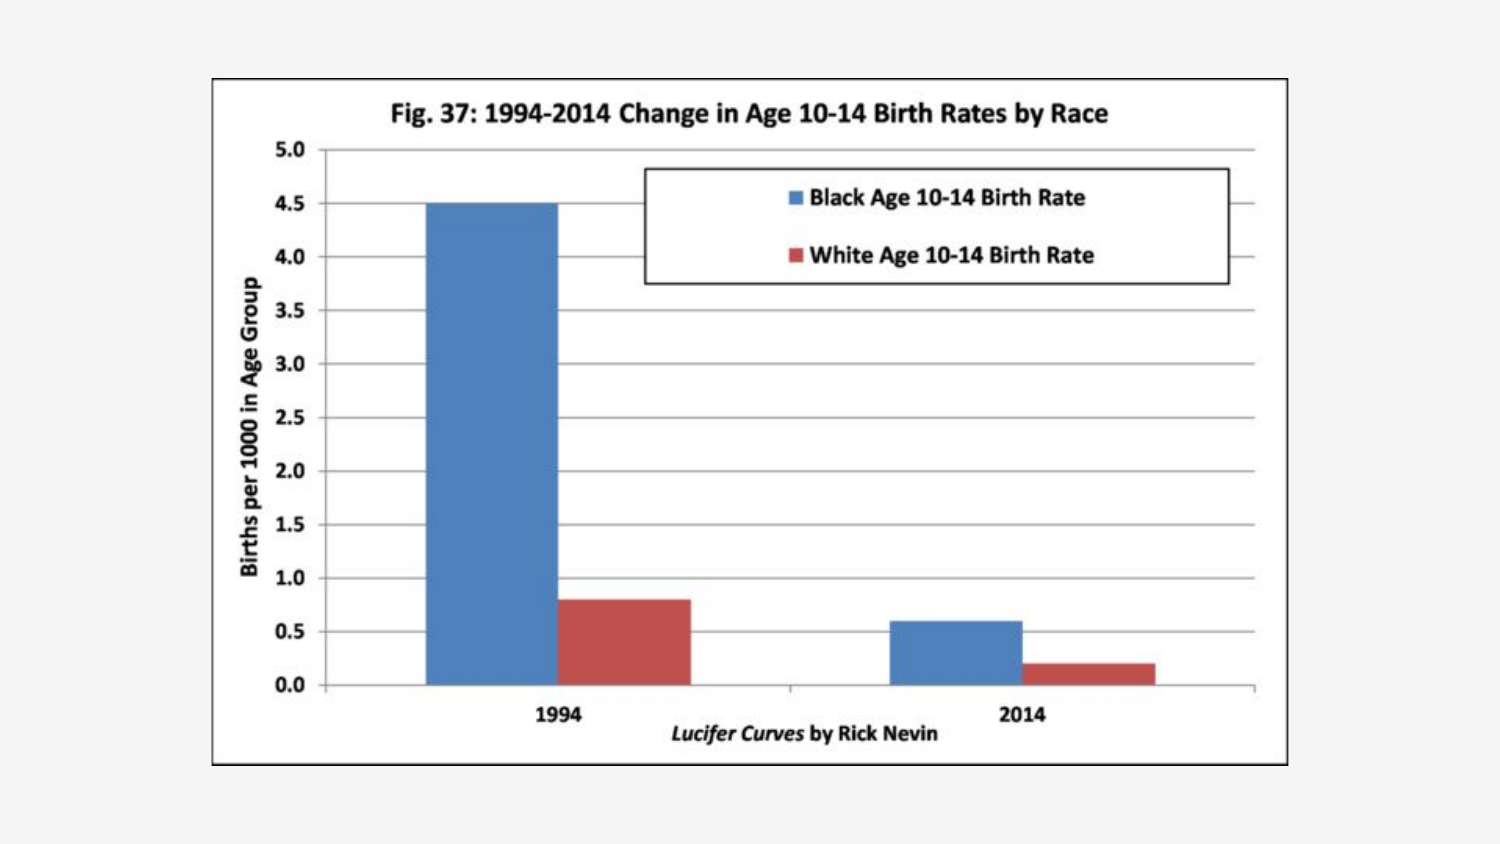
And although publications like The Bell Curve made high-profile speculation about the root cause of racial differences, more recent data show that, while both black and white children have improved across various metrics, black children have closed the gap to such an extent that in 2014 they experienced lower juvenile arrest, dropout, and pre-teen pregnancy rates than their 1994 white peers. This trend is consistent with overall reductions in BLLs, especially in disadvantaged communities.
Interventions and cost effectiveness
Childhood lead exposure in the United States has been declining for decades, and is currently at its lowest level since the Industrial Revolution. While we’ve highlighted a few heroes so far, the bulk of the work has been done by a faceless bureaucracy, who have designed and implemented regulations like the ban on leaded gasoline, among “the most important determinants of the decline in crime rates over the past two decades.”
But the work is far from finished. Since the CDC began collecting statistics on BLLs in 1997, they have documented nearly one million children exceeding their action threshold of 10 μg/dL, and a 2004 study estimates that there are another 120 million worldwide, accounting for nearly 1% of the total burden of disease. Worse yet, it’s estimated that nearly 10% of young children worldwide have BLLs exceeding 20 μg/dL, 99% of whom live in developing countries.
Below I’ll summarize three plausible interventions, and report on the cost effectiveness of each. Where possible, I’ll try to compare these with other EA cost estimates, but future research is needed to form a more comprehensive picture.
Early interventions
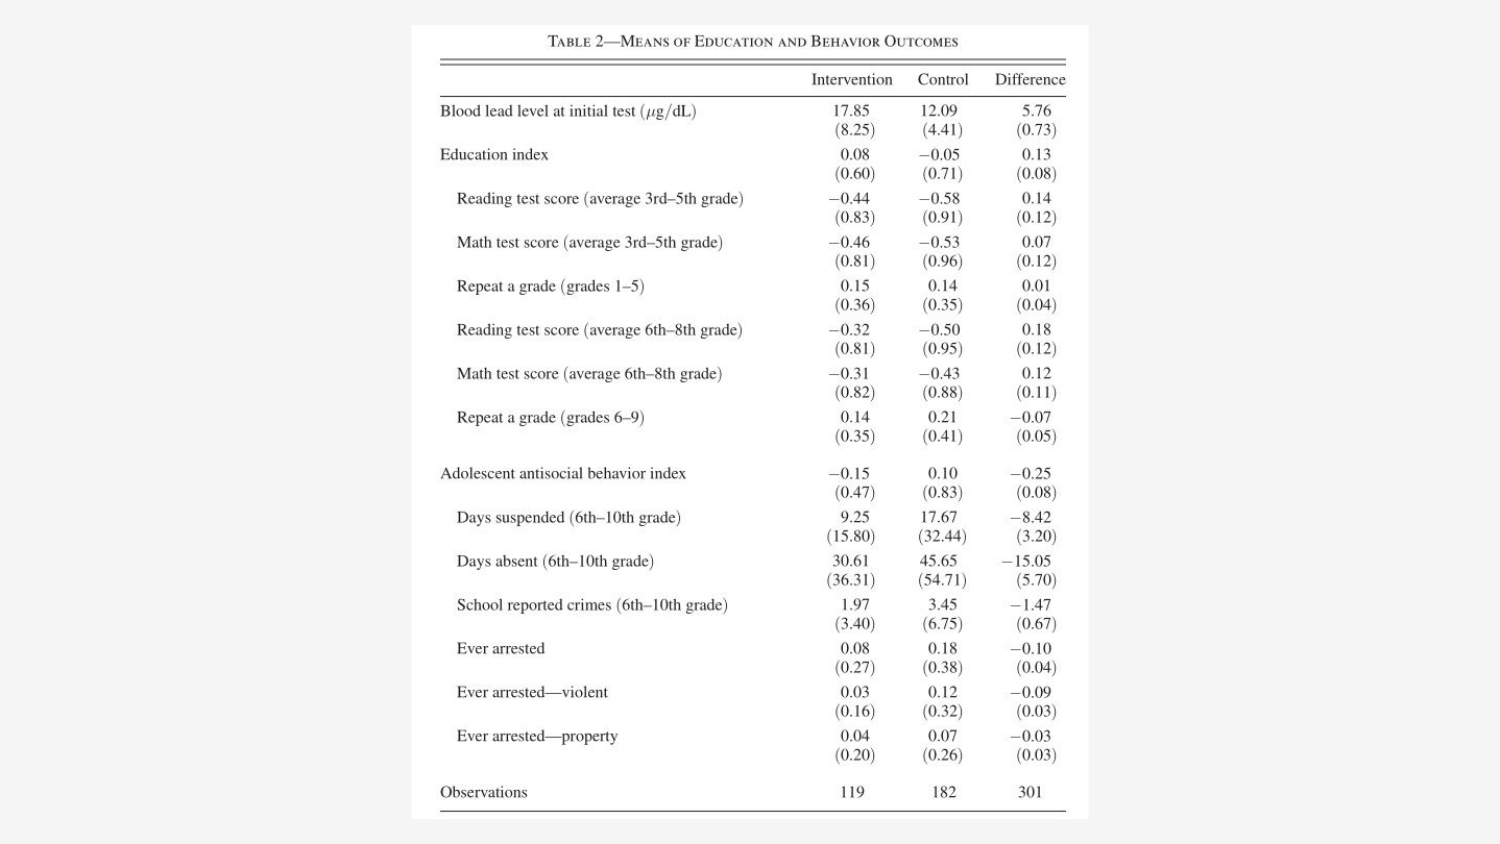
The first study comes from the American Economic Journal by Stephen Billings and Kevin T. Schnepel, titled “Life after Lead: Effects of Early Interventions for Children Exposed to Lead”. We talked earlier about how, when it comes to lead poisoning, there can be no true randomized control trials, but through clever design and analysis, this study comes about as close as you can get.
The basic premise is that, following CDC guidelines, the city of Charlotte, NC, takes increasingly expansive action as BLLs in individual children exceed thresholds starting at 10 μg/dL in consecutive tests. The goal of treatment “is to prevent further exposure, and to reduce lead levels in affected children,” with practitioners initially providing parents lead education and nutritional counseling.
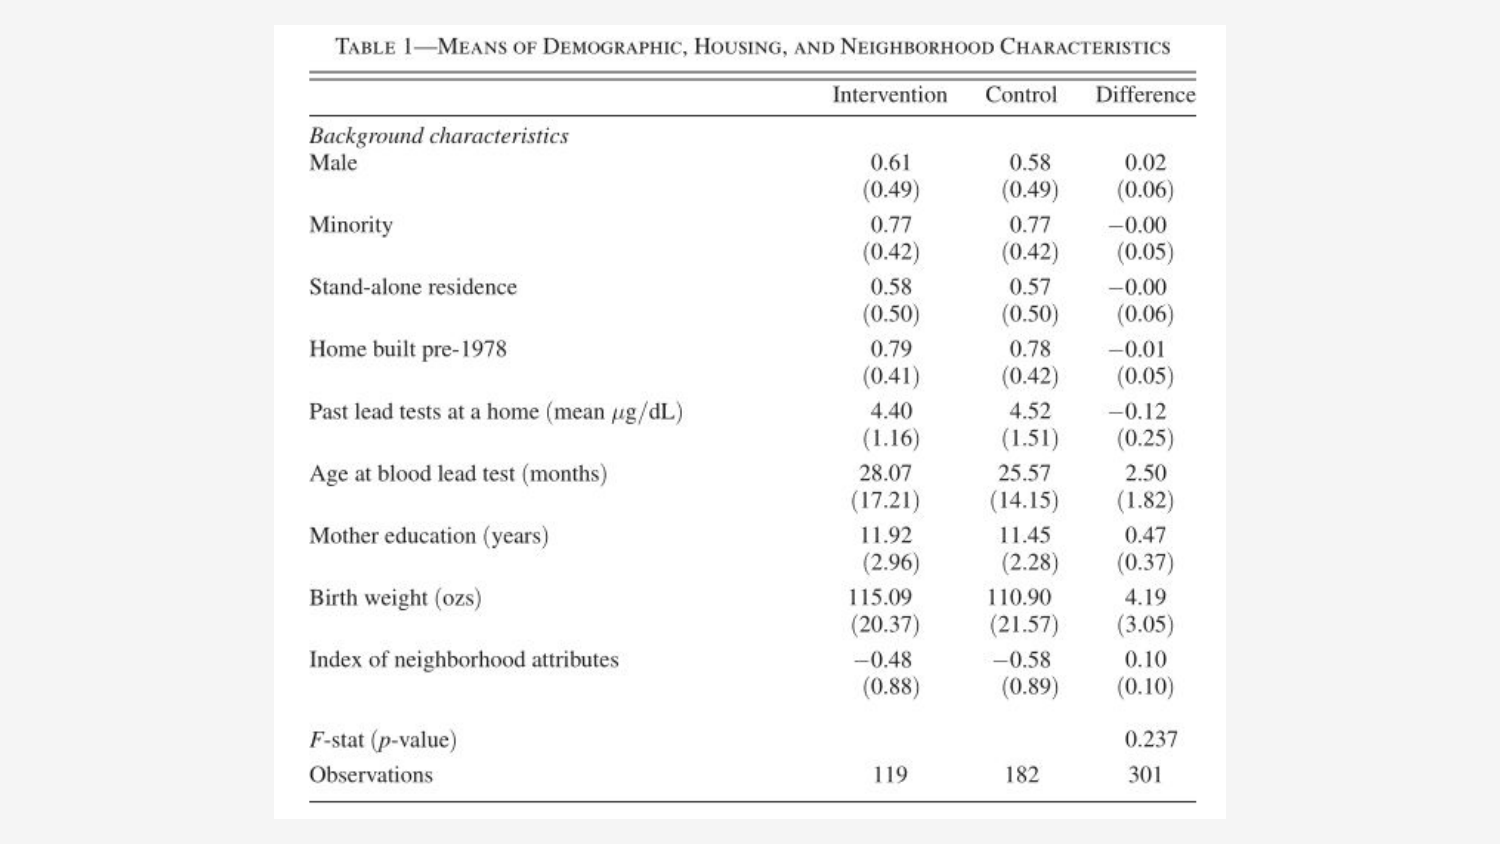
For their study, Billings and Schnepel noticed that children who had only one elevated blood test, with the second falling just below the threshold, had indistinguishable demographic characteristics as those who received treatment, serving as reasonable control group for their experiment. This is especially clever because, as the authors note, capillary blood tests (often performed on both the first and second round of testing) are notoriously prone to external contamination, making the differences between the treatment and control group plausibly randomized.
They gathered not only blood test data, but also birth certificate information and family history, administrative records from the school district, local criminal arrest records for the same cohort in young adulthood, and even county assessor data on household construction projects. Note that all the children in this study were born after 1990, on the tail end of exposure risks from leaded gasoline, so the results are likely still meaningful today.
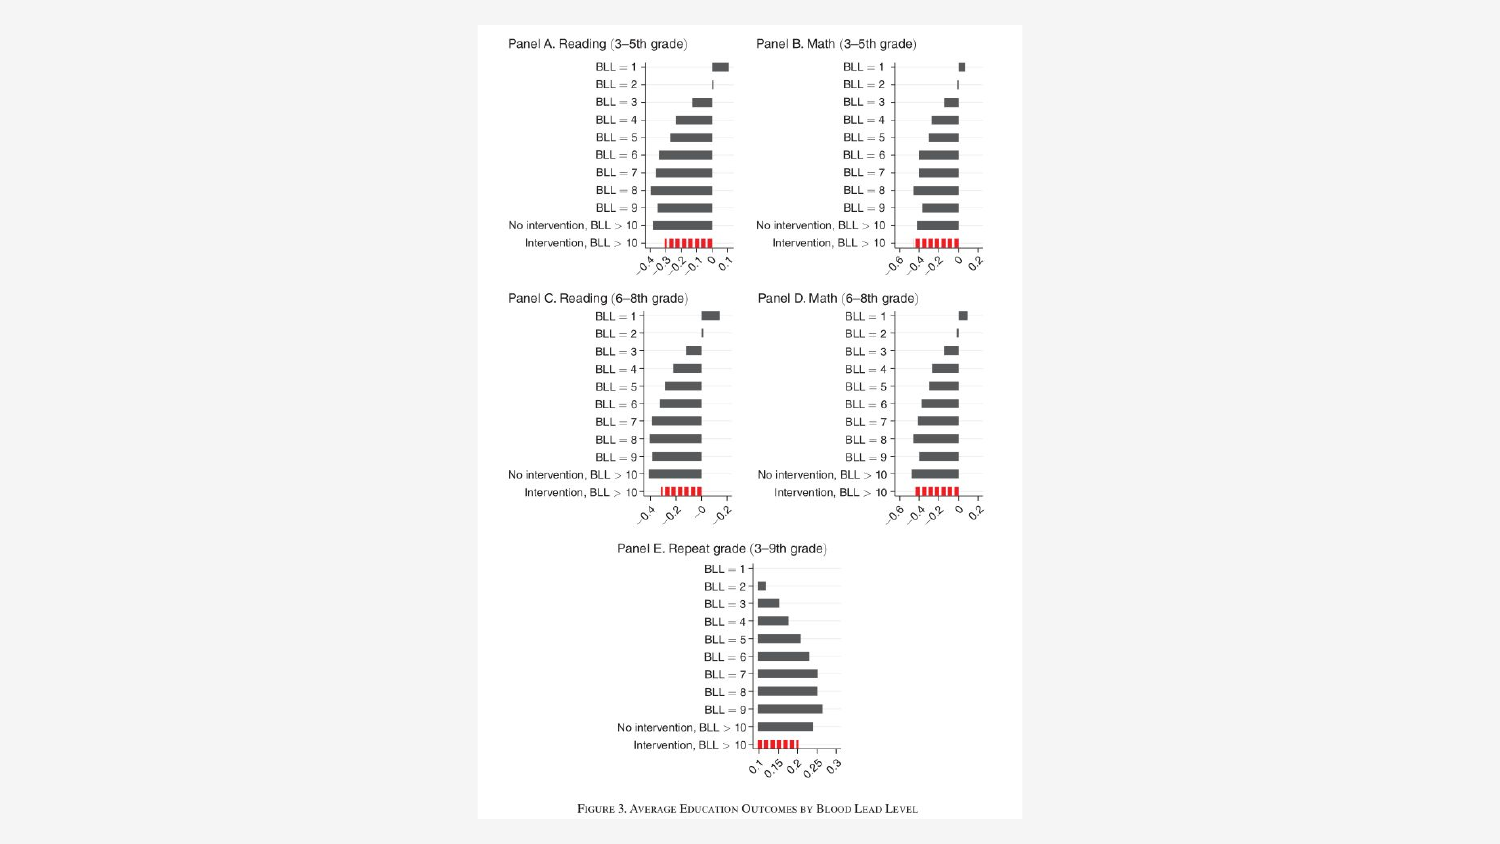
The authors found that children in the treatment group experienced an small improvement in educational outcomes:
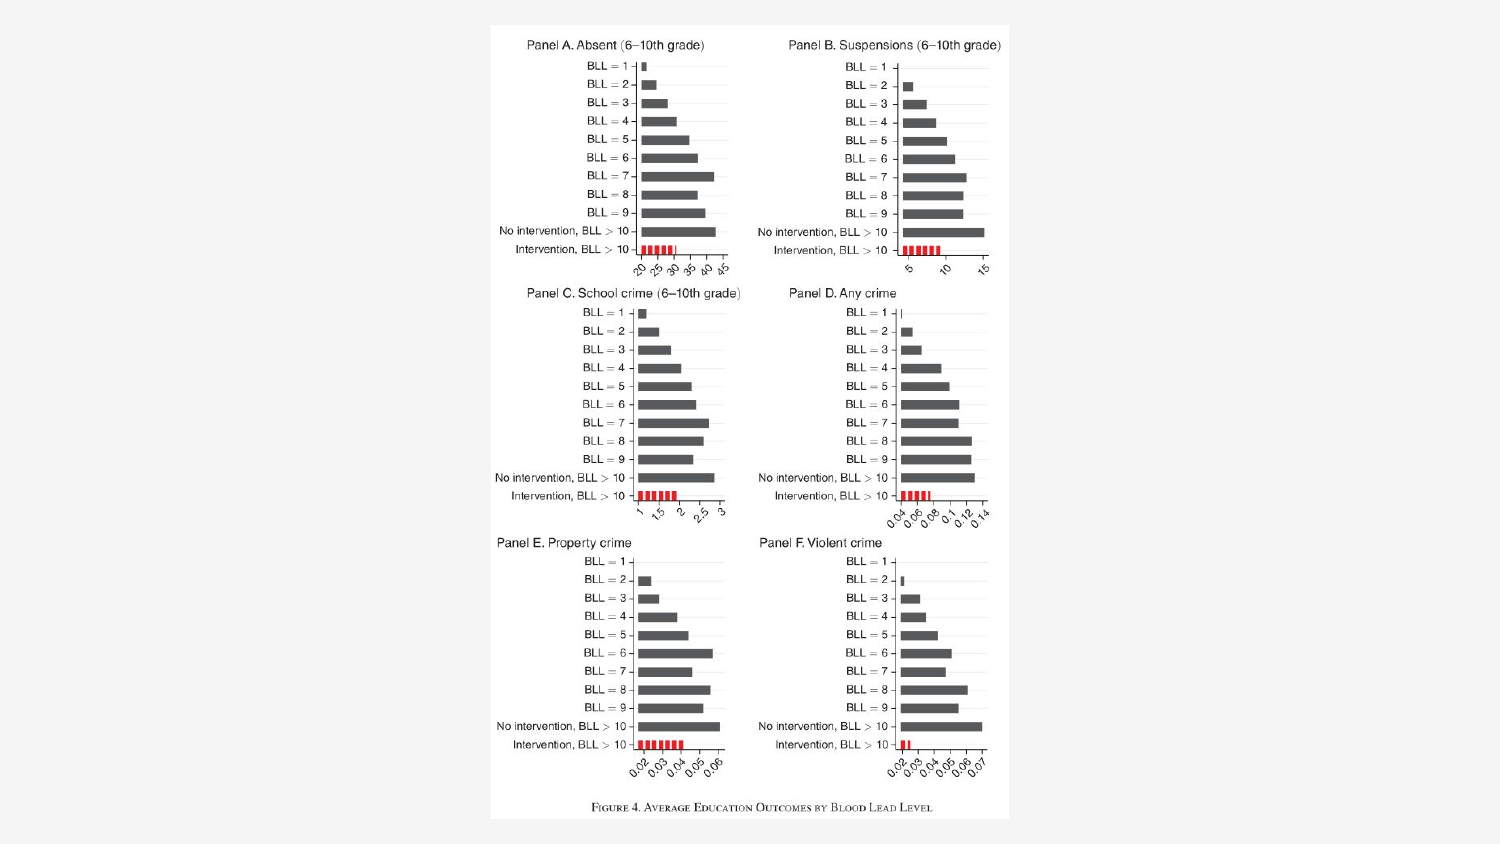
And a significant decline in behavioral risks, relative to the control group. These results are consistent with the harms associated with lead poisoning, and especially noteworthy because the treatment group had higher initial BLLs, on average. In fact, the authors were unable to reject the null hypothesis that the resulting behavioral score of the treatment group was different than the children with BLL lower than 5 μg/dL!
The authors also investigated children in the vicinity of the CDC’s 20 μg/dL threshold, above which an environmental investigation is conducted on the child’s home to identify the source of lead exposure, showing that “that children above 20 μg/dL have significantly better outcomes than those in the 15-20 range.”
Although this study only measured intent to treat, and was unable to determine if any actions were taken beyond the CDC recommendations, construction records suggest that there were, with parcels that received lead remediation more than three times as likely to be in the treatment as the control group. Although the sample size is small, remediation appears to have conferred benefits to both the younger siblings at the same address, and also to the young children of future residents. This result is consistent with prior studies, which show that remediation programs significantly reduce household lead dust, and others which find “mean BLLs of children whose housing was abated show a 38% decrease over a 2-year period after lead hazard control.”
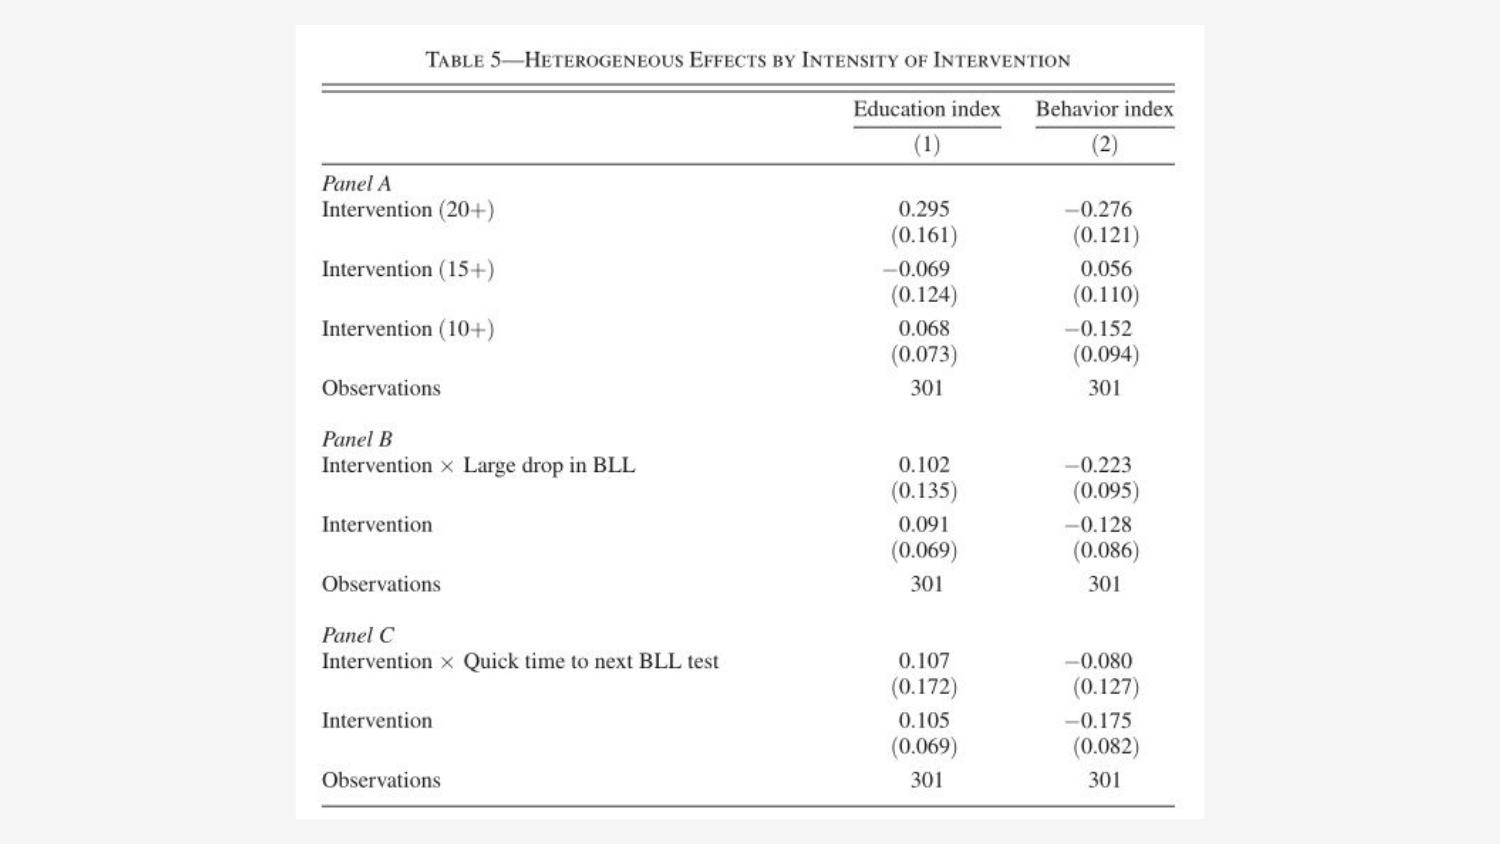
Finally, the authors note that:
we find larger effects for individuals experiencing a significant drop (more than 5 μg/dL) between the second and third BLL test. Individuals who experience a sharp drop in BLLs after two consecutive tests over the alert threshold are more likely to have benefited from a reduction in exposure.
However, besides the intent to treat problem, there are other caveats to consider. For one, related research shows that children generally benefit from all forms of early health interventions, and the improvement of treatment group across various metrics could plausibly be a result of better nutrition and increased parental attention.
Also, the known inaccuracies in BLL measurements, both related to capillary tests, and the half-life of lead in blood (approximately 30 days), mean there are large uncertainties in the data, dependent on both the method and exact date of testing relative to the exposure.
Still, the authors conclude that there is robust evidence in favor of their hypothesis, and recommend applying similar interventions at lower BLL thresholds. Despite an average cost of nearly $7,500 per home remediation, the expected benefits for this intervention (and similarly effective childhood health programs) are close to $10,000, giving the program an overall benefit-to-cost ratio of about 1.4:1.
Maybe more importantly, this study provides hope that some of the worst effects of childhood lead poisoning may not be permanent, and that (cost) effective interventions, already being practiced across the country, may have the potential for expansion.
Window replacement
Another paper, titled “Monetary Benefits of Preventing Childhood Lead Poisoning With Lead-Safe Window Replacements”, more directly examines the effects of lead remediation. Instead of going through the laborious process of determining which children have elevated BLLs, our old friend Nevin (et. al.) makes the case for just replacing all of the windows in pre-1960s housing.
To justify this considerable expense, they first point out that, since the near elimination of airborne lead associated with gasoline, the historical vestiges of lead paint in the housing infrastructure now represent the lowest hanging fruit for targeted remediation. Moreover, the harm caused by substandard housing disproportionately affects (the typical poorer) children living in pre-1940s housing, who are six times more likely to have elevated blood lead levels than their peers.
This makes sense, because the EPA found lead paint hazards in 68% of pre-1940 homes, compared to just 3% of post-1977 homes.
Lead paint hazards can be reduced via both interim controls and stabilization, or through permanent abatement, but for the purposes of this study, Nevin et. al. defined lead-safe window replacement to be:
- Replacement of all single-pane windows with high-efficiency ENERGY STAR windows;
- Stabilization of any significantly deteriorated paint;
- Specialized cleaning to remove any lead-contaminated dust following the repairs; and
- Clearance testing (which includes dust wipe analysis) to confirm the absence of lead dust hazards after project cleanup.
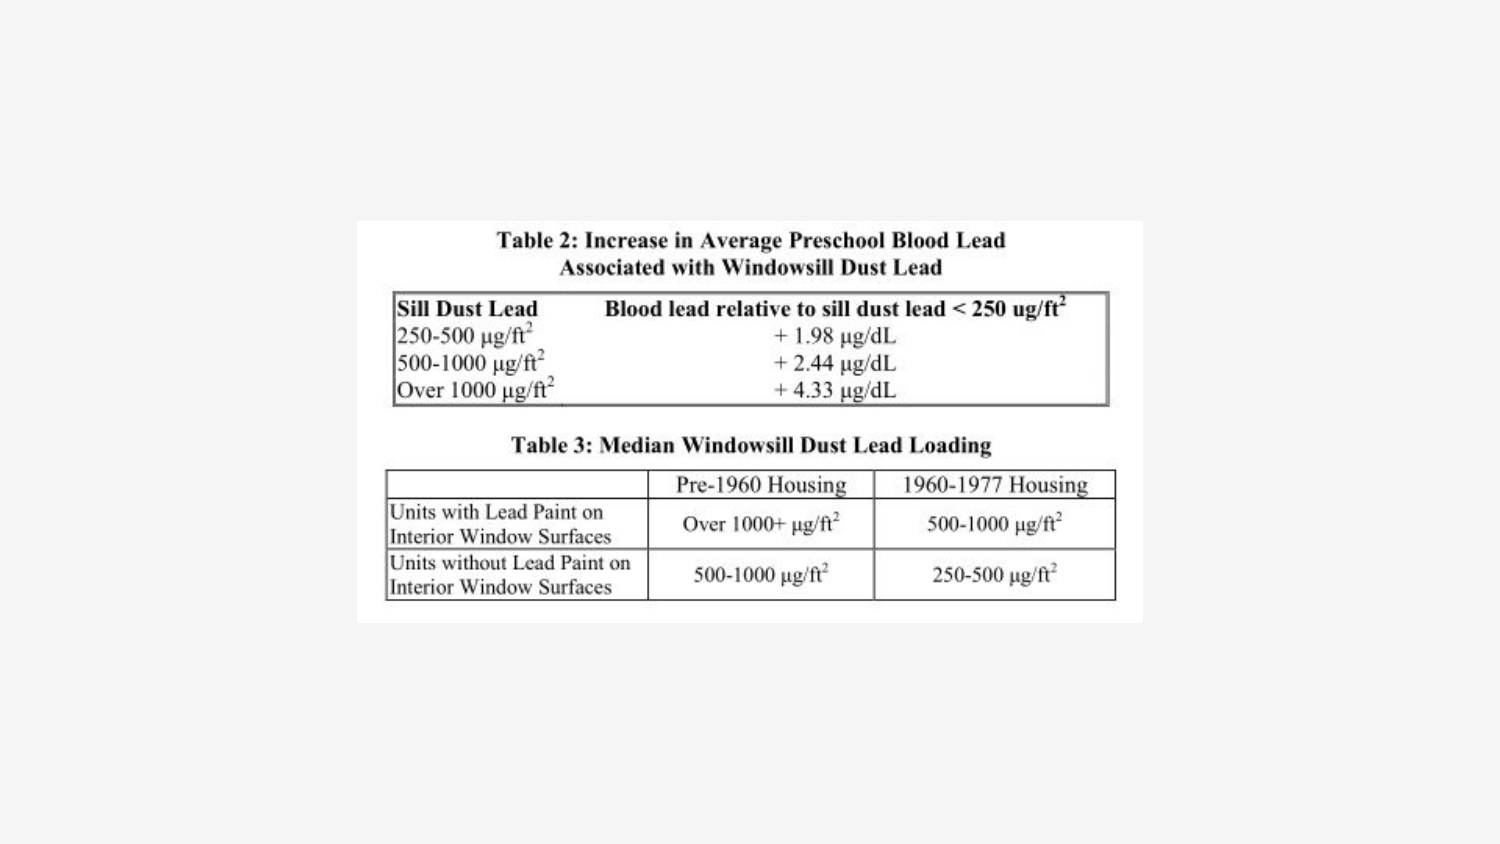
To calculate the cost effectiveness of window replacement, the authors first converted the benefits of eliminating household lead dust to IQ by estimating the BLL increase associated with varying degrees of contamination, and then the IQ loss associated with this change in BLL.
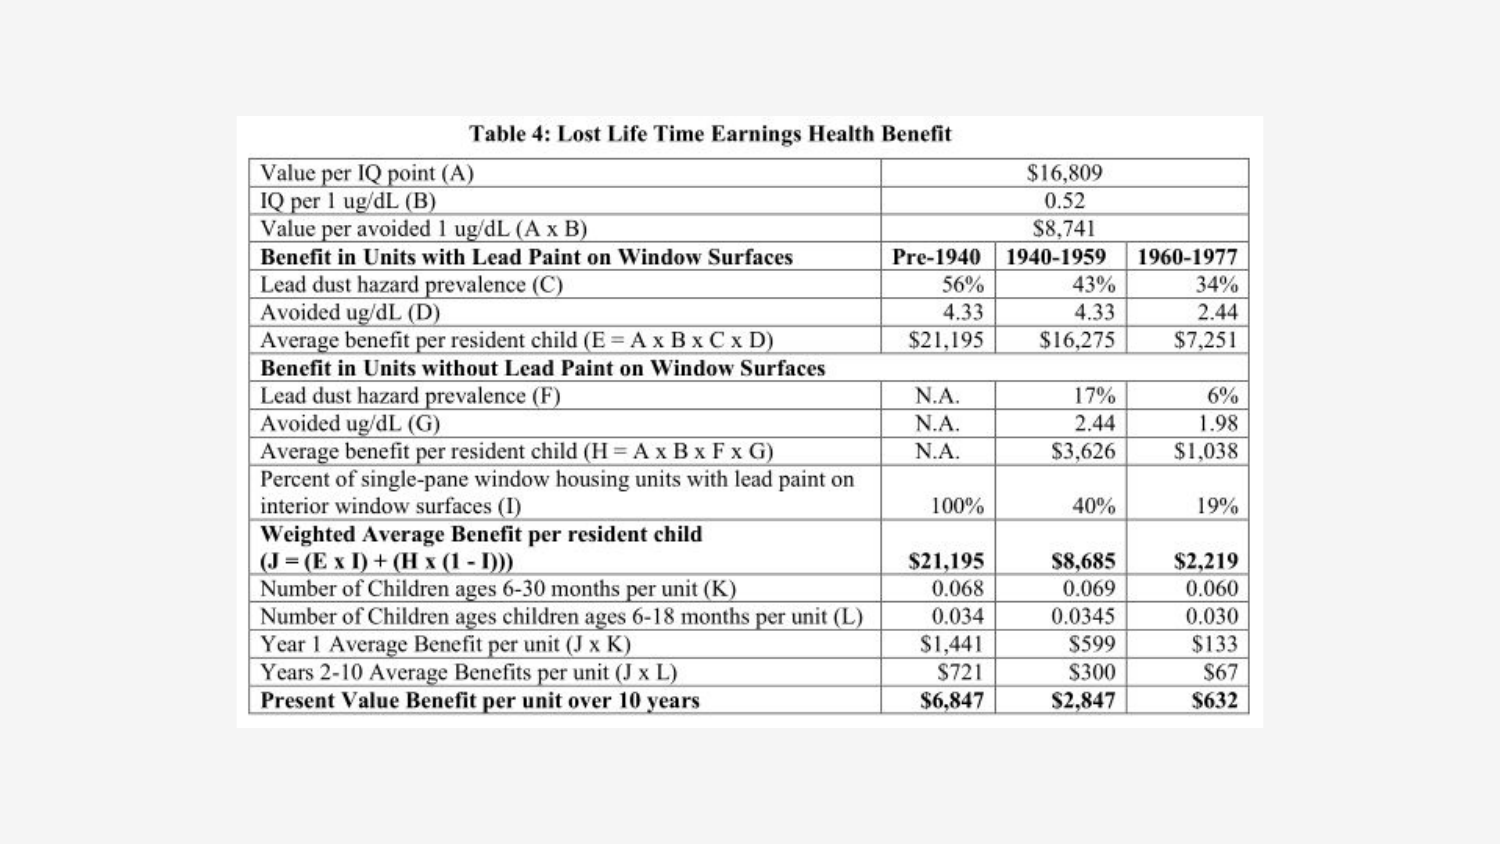
Next, they used a well-established estimate for the lifetime earnings benefit of each additional IQ point ($16,809), along with a variety of empirical factors related to the hazard prevalence across historical housing construction periods, to find the value associated with each category of remediation.
Nevin et. al. note that this is likely a conservative estimate, because they assumed the benefits of environmental lead reduction would only be realized in children younger than 30 months, and also included a 1/5 factor in the calculation to reflect the probable presence of deteriorated paint.
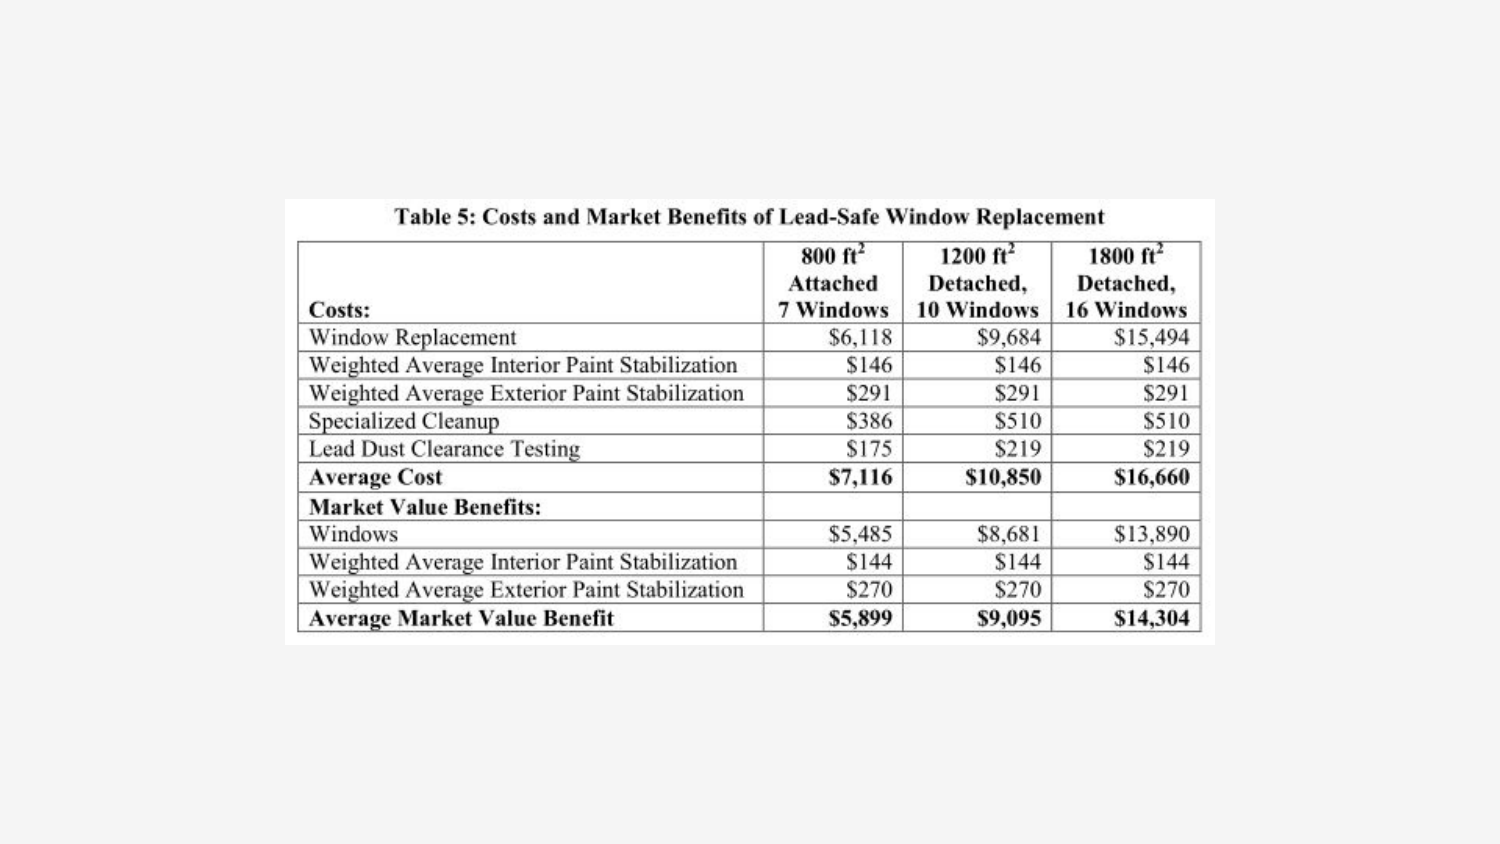
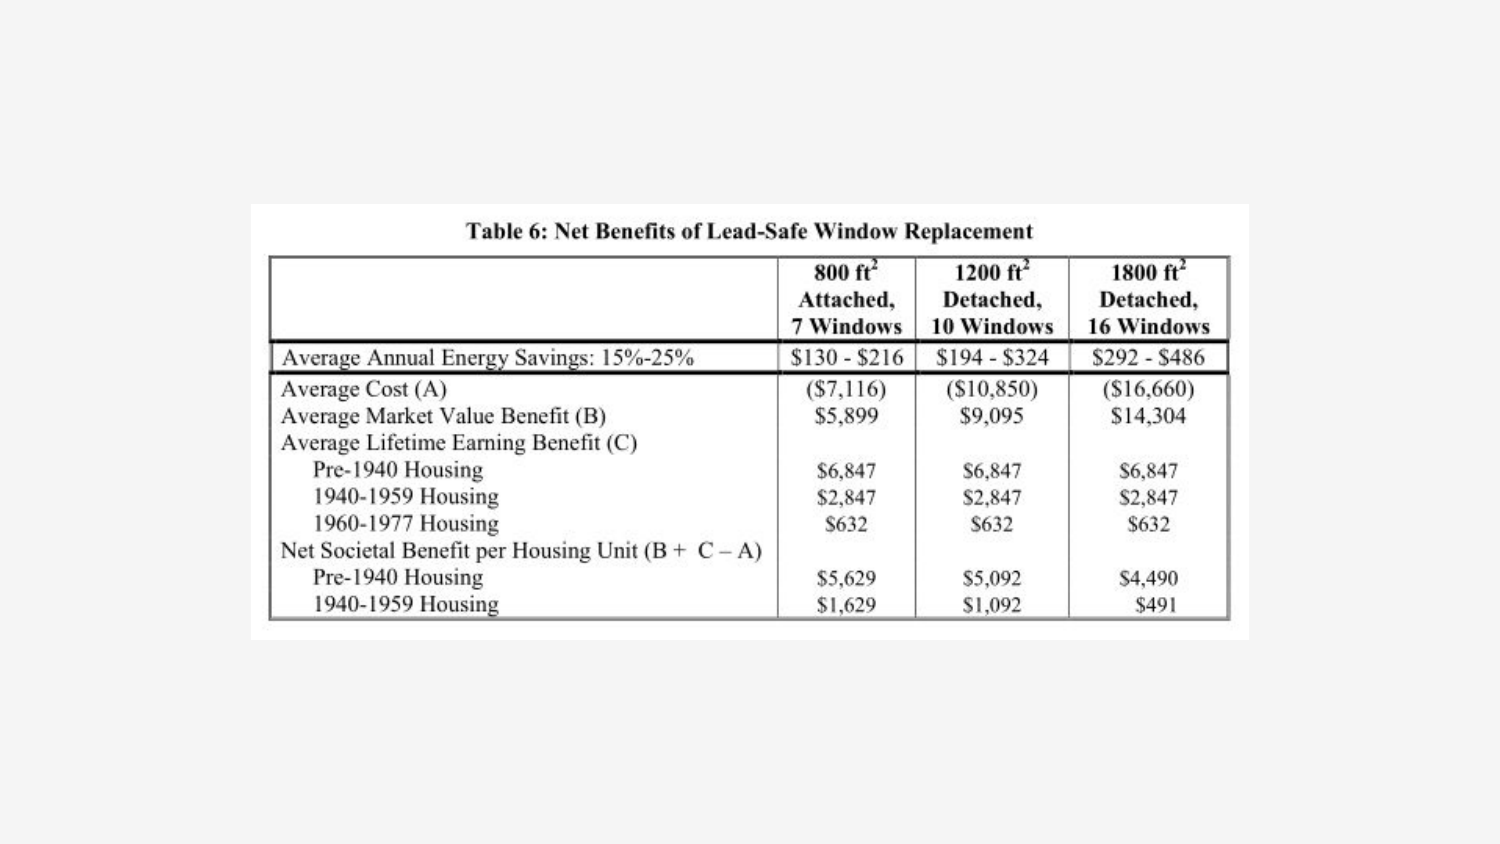
Finally, they considered the costs of window replacement for a variety of household scenarios, and compared those against the improvement associated with new windows on the household market value, as shown in the figure below.
Putting it all together, and including the energy savings associated with more efficient windows, the authors report a net societal benefit of about $5,000 for each pre-1940s housing unit remediated, or up to $67 billion if applied to the entire stock of pre-1960s housing.
Note that, again, this is likely a conservative estimate. The societal benefit of averting diseases such as ADHD, also correlated with lead poisoning, along with the corresponding reduction in violent crime detailed in Nevin’s other work, might save up to an additional $45 billion dollars per year, even before considering the reduction in greenhouse gas emissions associated with more efficient household heating and air conditioning.
Nevin suggests that a one-time federal expenditure of $22 billion, in the form of $100 credits per window replaced, might be sufficient to incentive much of this change, and would pay for itself in less than a year. He continues:
We should set a national goal to replace all single-pane windows in pre-1978 housing, targeting pre-1950 housing as the first priority. This goal can be achieved by replicating the proven success of the Illinois Comprehensive Lead Education, Reduction, and Window Replacement (Clear-Win) pilot program.
That program, which reported on its results in a separate 2016 paper, found that window replacement significantly reduced household lead dust, while simultaneously increasing thermal comfort and reducing energy bills, all at a 1.7:1 benefit to cost ratio.
Water filter distribution
Finally, I’ll quickly summarize some of my earlier work on childhood lead poisoning from drinking water in Chicago, but a more detailed analysis can be found elsewhere on my blog.
Back at the beginning of this post, I mentioned attending a talk by PERRO’s Troy Hernandez, which represented my first exposure to the lead hypothesis back in 2017. What I didn’t say was that, after his speech was finished, I cornered him in the back of the the lecture hall and demand to know what I personally could do to solve the problem.
After I calmed down a bit, Troy and I exchanged information, and that turned out to be the beginning of a partnership between our two organizations that would take in $10K from two separate grants, and provide free lead-rated water filters to nearly 500 Pilsen children under the age of six.
In order to secure these grants, we put together a cost benefit analysis, which I’ll briefly describe below, but should sound somewhat familiar after the previous two summaries.
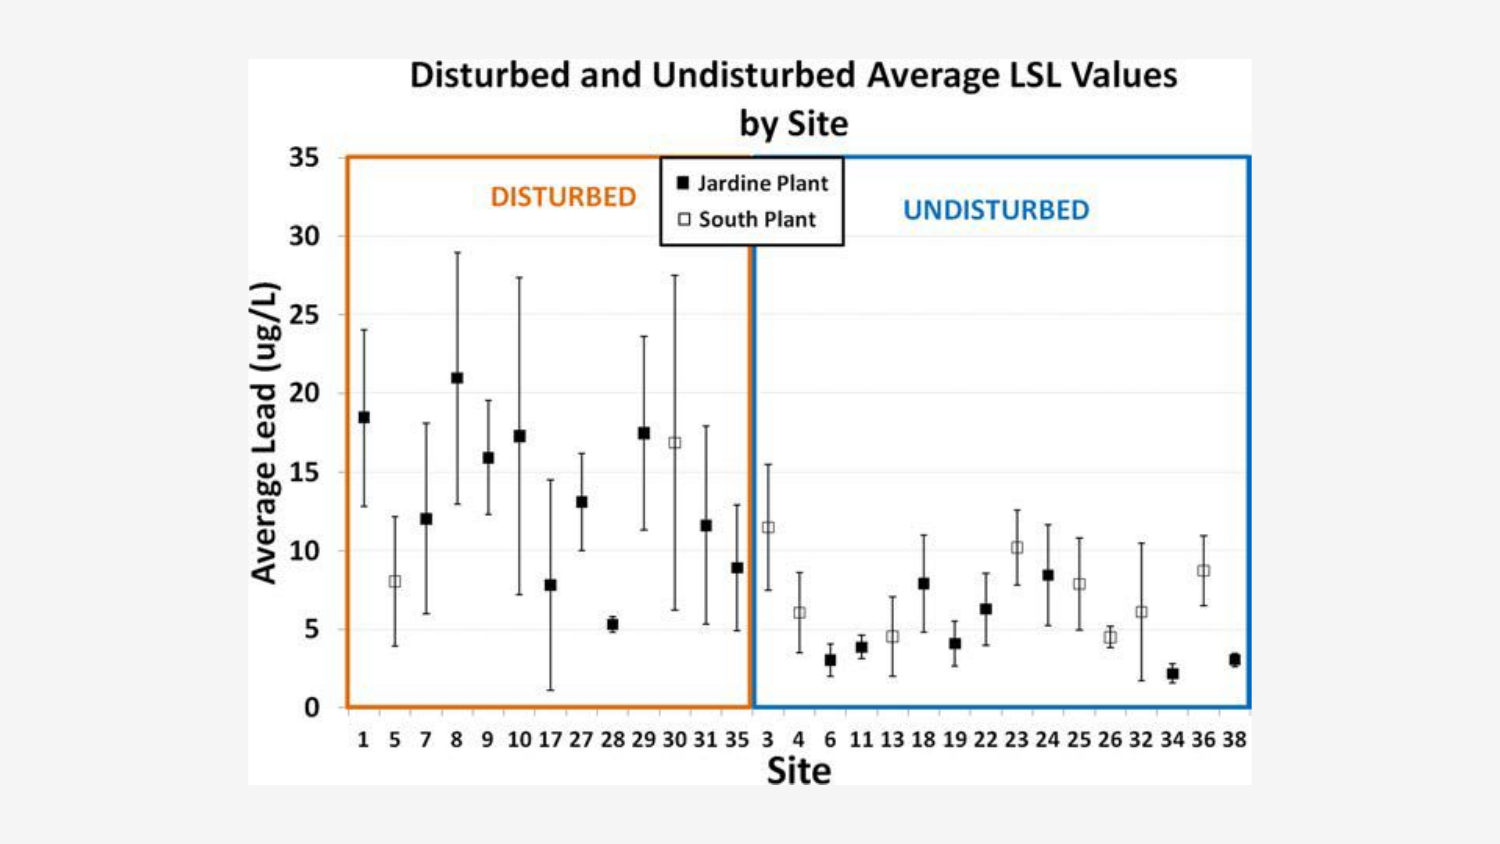
First, we needed to establish the baseline rate of lead in Chicago’s water supply. As most locals are already aware, if only from the ubiquitous street construction, Chicago is in the middle of a 10 year plan to replace it’s entire aging water main infrastructure. Local EPA employee and Flint hero Miguel Del Toral authored a 2013 study demonstrating that, among other things, water main replacement can disturb LSLs, and temporarily raise the quantity of lead in tap water.
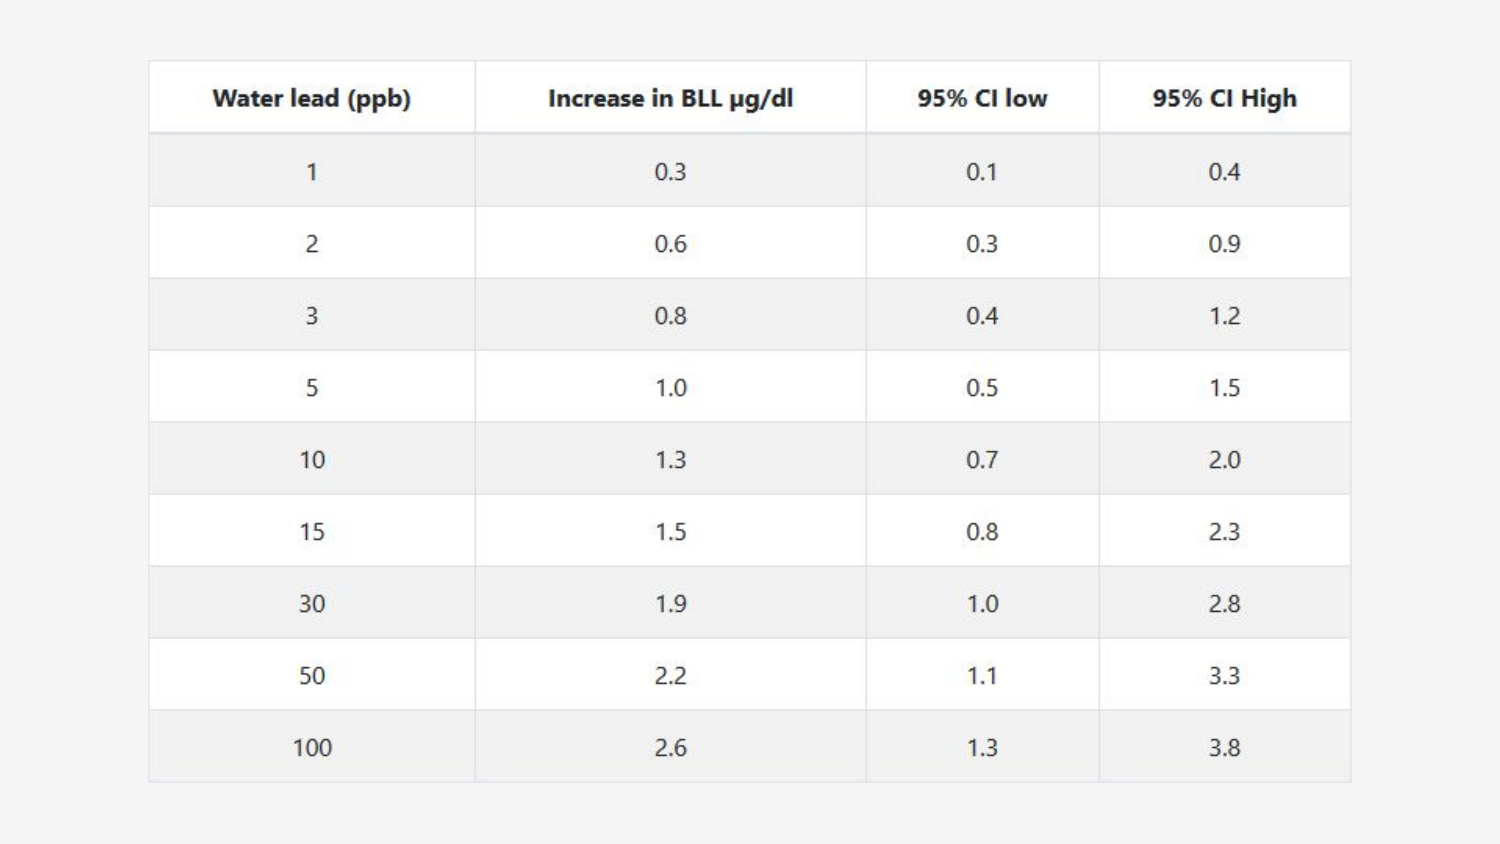
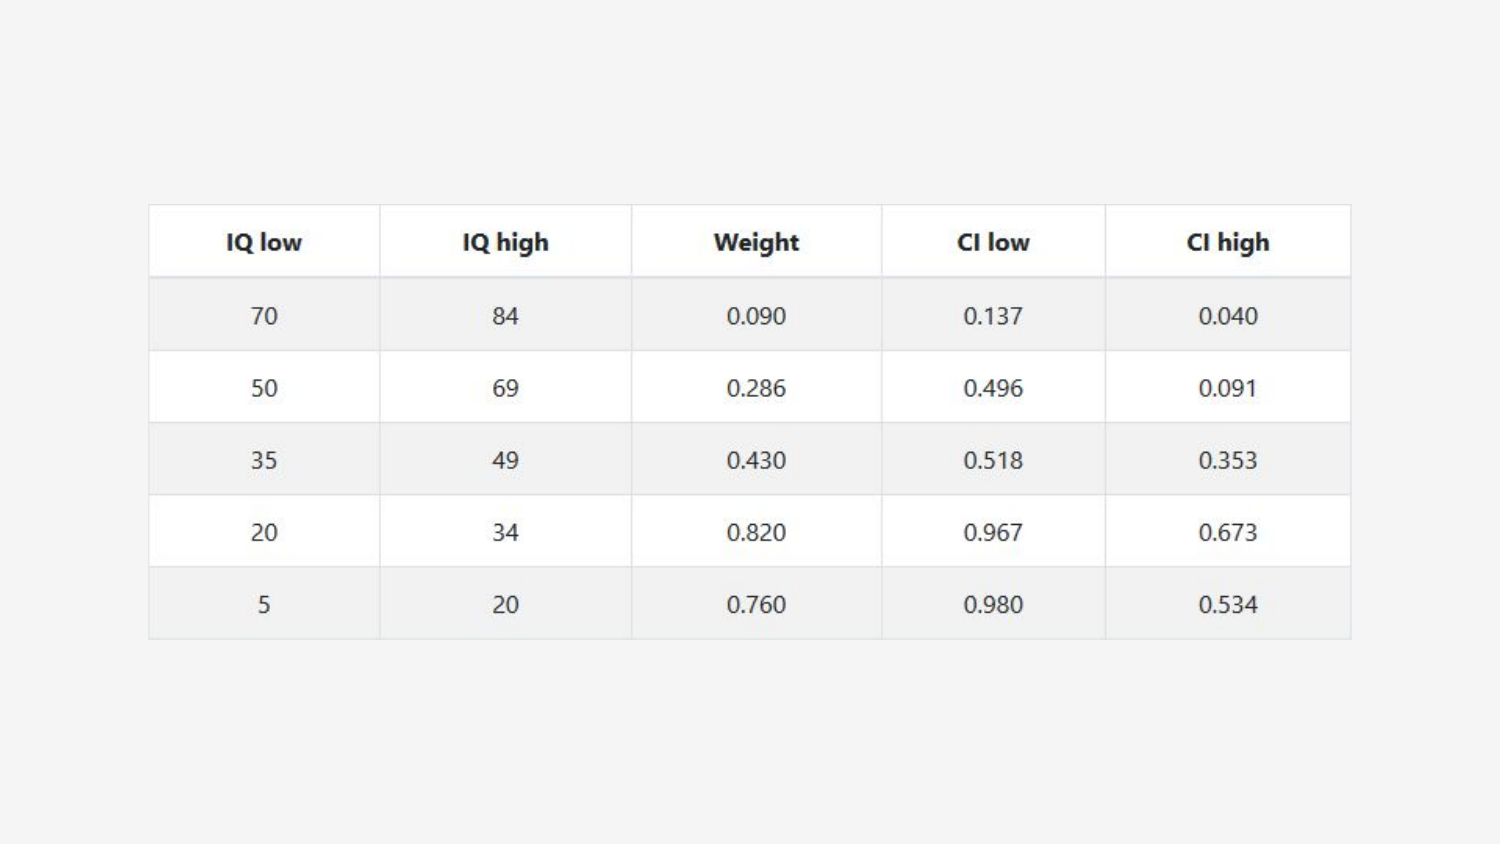
Like Nevin’s work above, it was then necessary to convert this environmental hazard into BLLs, and for this we used a best fit linear regression of the following table from Bruce Lanphear’s 1998 paper “Environmental Exposures to Lead and Urban Children’s Blood Lead Levels”:
Next, to go from BLL to to IQ loss, we used data from a meta-analysis (again by Lanphear et. al.) titled “Low-Level Environmental Lead Exposure and Children’s Intellectual Function: An International Pooled Analysis”, which included the following graph (showing the same steep decline in IQ scores at relatively low BLLs as in Nevin’s work):
Unlike Nevin, who converted IQ loss to a decrease in lifetime earnings potential, we instead used estimates from the Global Burden of Disease to fit a linear regression between IQ sigma value ranges and Disability Adjusted Life Years.
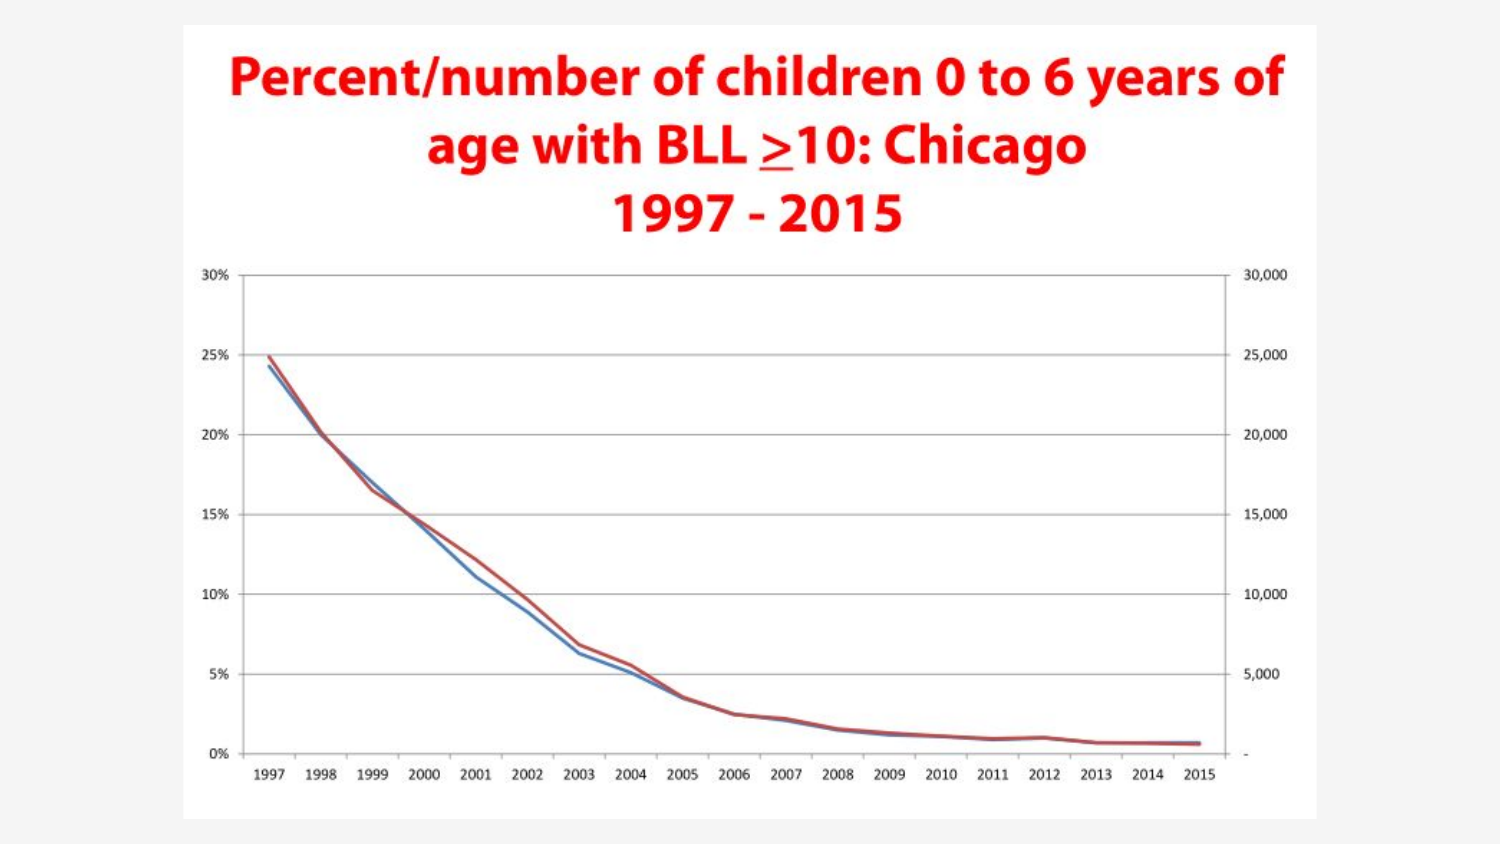
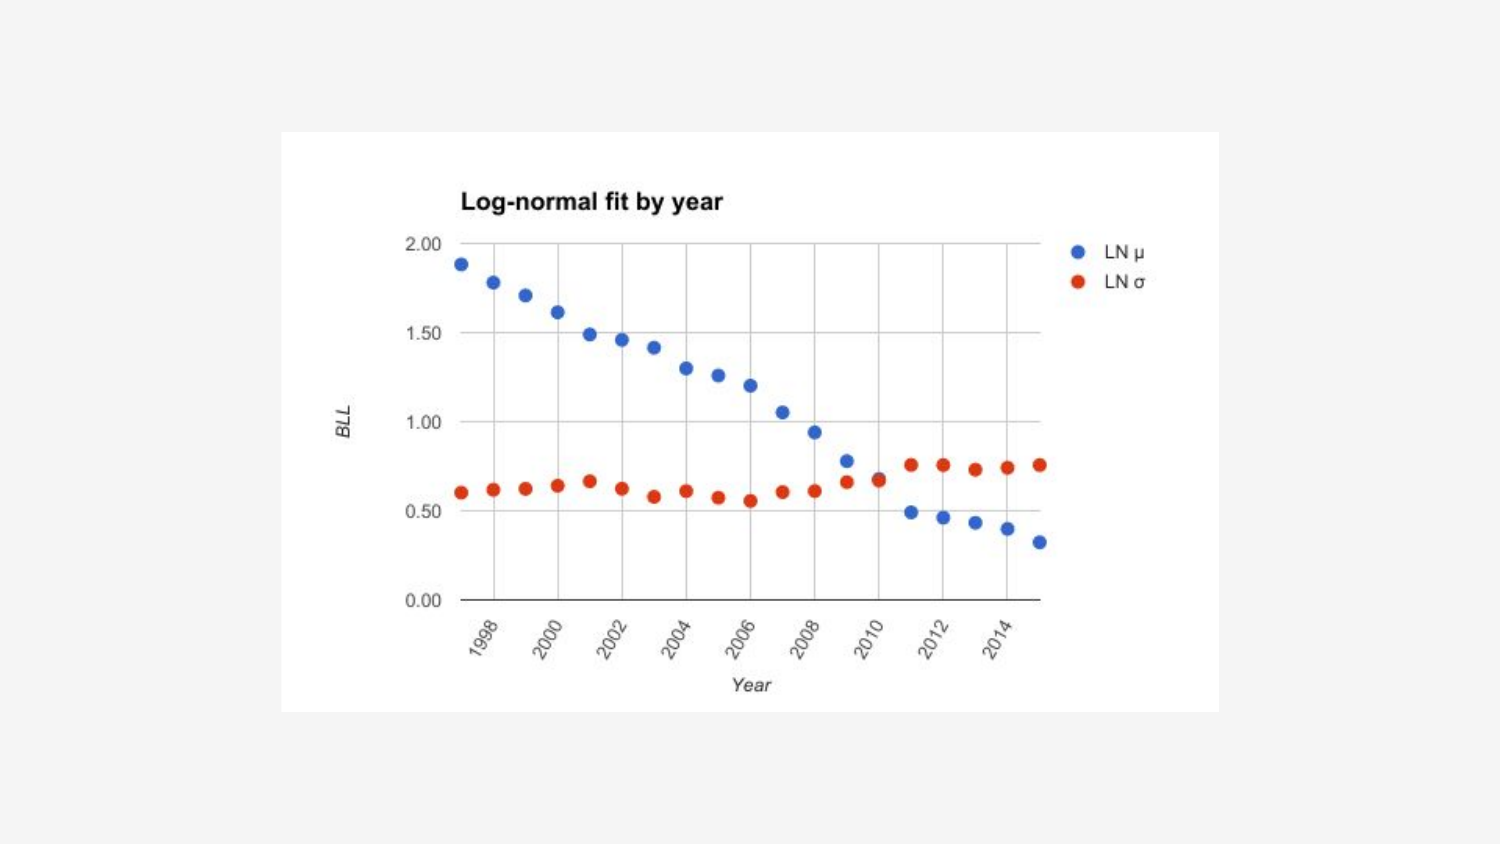
Finally, after much difficulty, we found the an approximate lognormal distribution of current BLL levels in Chicago children by scraping values from several charts included in an online presentation by Chicago’s Medical Director for Environmental Health. (Don’t try this at home.)
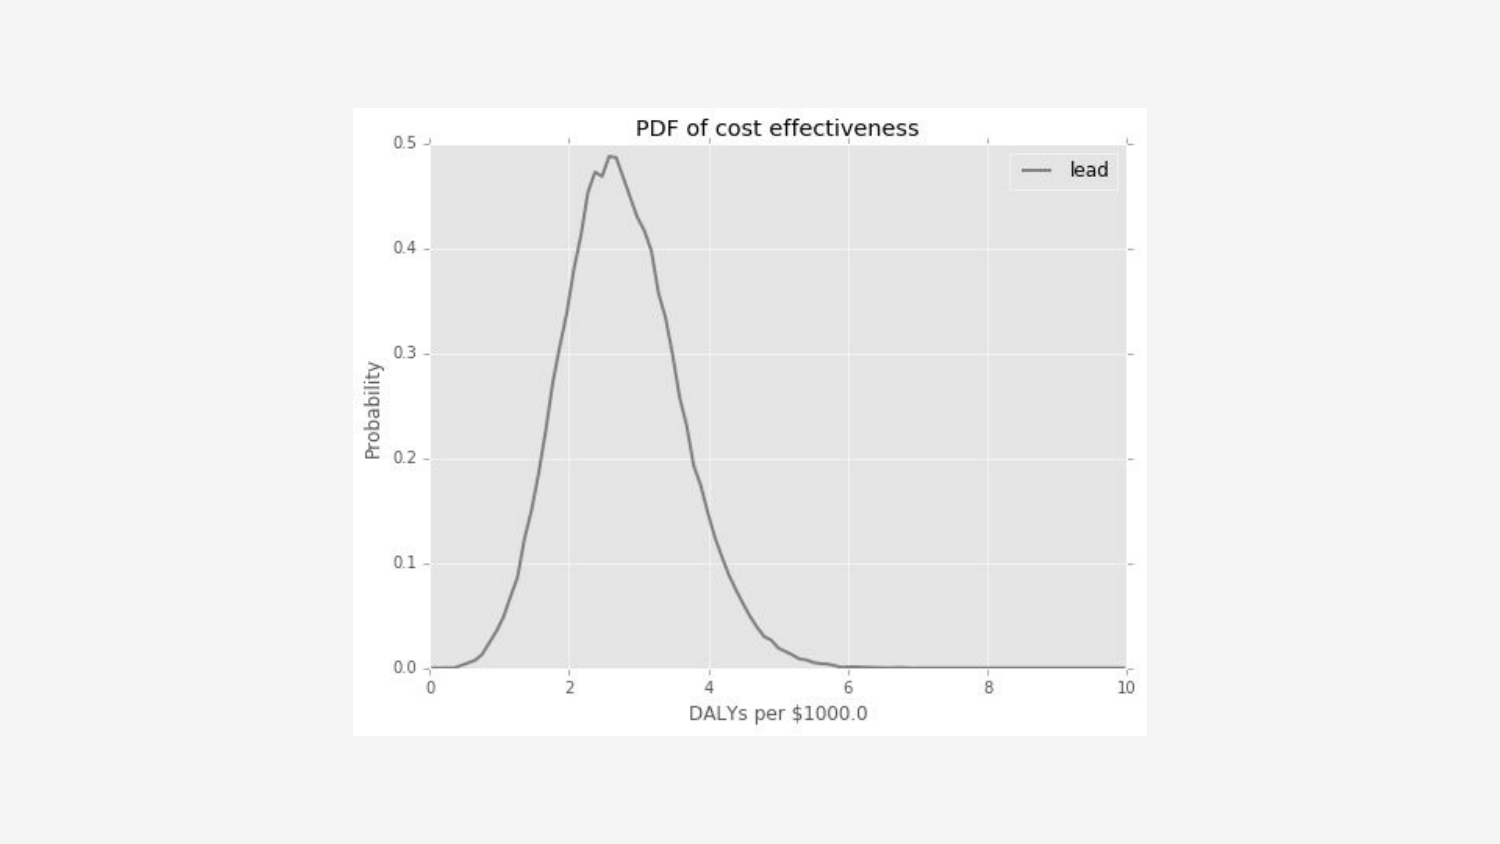
With the full suite of data and correlations available, we ran a series of Monte Carlo simulations, generating random cohorts of children representing the likely recipients of our free filter distribution. As summarized on the table below, we found that, for a cost of less than $50/child, we could provide up to four months of lead protection after a nearby water main replacement.
This, in turn works out a median projection of approximately three DALYs per $1000, or about 1/4 the cost effectiveness of GiveWell’s gold standard, the Against Malaria Foundation; not too shabby for a local intervention.
Conclusion
Earlier, I posed a set of questions to guide our investigation into a potentially causal link between lead poisoning and negative individual and societal outcomes. Let’s briefly review those questions, and check them against the evidence provided above.
| Question | Verdict | Notes |
|---|---|---|
| Does exposure to environmental lead cause measurable biological damage? | Yes, lead mimics other essential minerals, causing cell death, weakening the blood brain barrier, and destroying myelin sheaths around white matter neural connections. | |
| Is there a dose-response relationship? | Maybe, but this would require a more thorough review of the literature. | |
| Does this biological damage plausibly lead to negative individual or societal outcomes? | Yes, lead poisoning is a known neurotoxin, and has been demonstrably linked with reduced IQ and teenage impulse control. Lead was also a leading indicator for the rise and fall of societal violence in the 20th century, though causation can’t explicitly be determined from the available data. | |
| Does more damage lead to even worse outcomes? | Yes, a meta-analysis of IQ studies shows a well defined dose-response relationship with BLLs, with an especially steep decline at low BLLs. | |
| Are there natural experiments happening due to varying regulations in different locations? | Yes, Nevin finds that, at different times throughout the 20th century, a diverse cross section of countries experienced elevated childhood BLLs correlated with similarly time-lagged negative outcomes. | |
| Do interventions lead to a reduction in biological damage? | Probably. Billings and Schnepel show that an intent to treat elevated childhood BLLs both reduces BLL in subsequent tests, and also improves education and behavioral outcomes. However, limitations in the underlying data make it unclear which part of the intervention was responsible. | |
| Does reduced damage lead to fewer negative outcomes? | Again, probably. The same study shows that children with the steepest decline in BLL had correspondingly better outcomes, but similar caveats as above apply. |
Organizations
A truly comprehensive review of lead poisoning as an EA cause area would not be a complete without a GiveWell style analysis of the organizations already working in this area, but that will have to wait for another post. For now, here’s a quick rundown of some non-profits that I plan to investigate over the next giving season:
- American Academy of Pediatrics, which provides, among other services, resources about lead screening and treatment.
- CLEARCorps Detroit is a member of the non-profit Southeastern Michigan Health Association, whose Lead Safe Homes Program abates lead hazards from homes in Detroit.
- Green & Healthy Homes Initiate, whose mission is to “break the link between unhealthy housing and unhealthy families by creating and advocating for healthy, safe and energy efficient homes.””
- Lead Abatement Resource Center, a Chicago-based organization whose mission is to “collect, evaluate, invent, implement, advocate and research effective solutions to lead hazards in the environment.”
- National Center for Healthy Housing’s Find It, Fix It, Fund It initiative, aimed at finding and eliminating lead hazards, and building the political will to create key public investments and policies to do so. (Note: they partially funded the Pilsen filter giveaway.)
- National Safety Council, which provides information about outreach and training programs that give community-based organizations the tools and skills needed for planning and executing successful lead poisoning prevention programs.
