Chicago's (Ongoing) Lead Crisis
The average blood lead level (BLL) of children in Chicago has been on a steady decline for more than two decades, thanks mostly to federal bans on the use of leaded paint and gasoline (a strong argument for the continued funding of the EPA). In a city that has become a symbol for the resurgence of violence in urban America, this is reason enough for hope in a more peaceful future. But despite the substantial improvements, there remains a source of lead that affects close to 80% of the city’s kids.
Service lines carry tap water on the last leg of its journey to a home, connecting the water main to the internal plumbing. Chicago mandated the use of lead in these pipes until it was banned nationwide in 1986, even though the harmful health effects of lead poisoning were well established long before then. And as the ongoing crisis in Flint has shown, these dormant lead pipes can unfurl into a public health nightmare when the municipal water supply is improperly maintained.
In a 2012 study, Flint whistle-blower and EPA scientist Miguel Del Toral showed that Chicago’s lead service lines can become reactivated by routine maintenance (such as meter installation or water main replacement), leading to years of high in-home water lead levels. This alone would be problematic enough, but it’s especially worrisome in the context of the city’s decade-long, multi-billion dollar effort to replace its ancient water infrastructure, which has the potential to disturb the majority of the city’s LSLs.
In this post I’ll develop a model to quantify the effects of this maintenance on public health, and the cost effectiveness of distributing water filters to at-risk families.
- Estimating health impacts
- Water lead to BLL
- BLL to IQ loss
- IQ loss to disability weight
- Lead poisoning in Chicago
- The whole thing
- Simulating the solution
- Filtering Chicago’s water
- The cost effectiveness of filtration
- Future work
Estimating health impacts
The World Health Organization proposed a framework to help measure the effects of lead poisoning in a 2002 report entitled Lead: Assessing the environmental burden of disease at national and local levels. Although the authors considered a spectrum of associated medical conditions (anemia, gastrointestinal symptoms, high blood pressure), cognitive impairment (IQ loss) due to lead poisoning represents the greatest threat to children with relatively low lead exposure.
In order to calculate the overall impact of decreased IQ on a community, the WHO report leveraged studies linking BLL to IQ, and IQ to disability. To extend this estimate to Chicago’s water infrastructure, two additional factors are required: the current state of lead poisoning in the city, and the relationship between water lead level and BLL. I’ll summarize each step of the calculation process in the sections below.
Water lead to BLL
The association between lead in the water and BLL was established by Bruce Lanphear in his 1998 paper Environmental Exposures to Lead and Urban Children’s Blood Lead Levels. The data from Table 6 is shown below:
| Water lead (ppb) | Increase in BLL µg/dl | 95% CI low | 95% CI High |
|---|---|---|---|
| 1 | 0.3 | 0.1 | 0.4 |
| 2 | 0.6 | 0.3 | 0.9 |
| 3 | 0.8 | 0.4 | 1.2 |
| 5 | 1.0 | 0.5 | 1.5 |
| 10 | 1.3 | 0.7 | 2.0 |
| 15 | 1.5 | 0.8 | 2.3 |
| 30 | 1.9 | 1.0 | 2.8 |
| 50 | 2.2 | 1.1 | 3.3 |
| 100 | 2.6 | 1.3 | 3.8 |
In the paper, Lanphear suggests a log-linear relationship between water and blood lead. A log-linear regression on the above data produces the following values:
                 coef    std err          t      P>|t|
------------------------------------------------------
const          0.2369      0.037      6.334      0.000
x1             0.4952      0.014     35.582      0.000
BLL to IQ loss
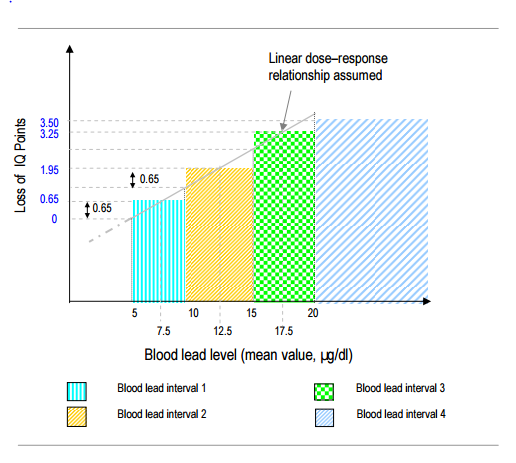
The WHO report references a 1994 meta-analysis to infer the relationship between BLL and IQ loss, fitting a linear model to the data as shown here:
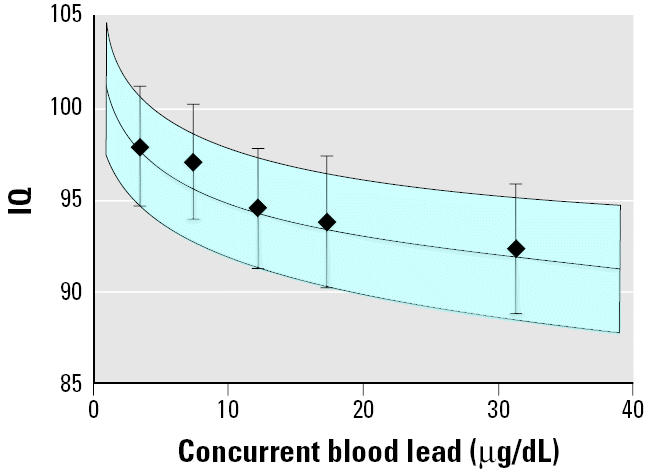
However, a more recent study (again by Lanphear) shows that the linearity assumption does not hold at low BLLs (below 5 μg/dL), and instead suggests a log-linear relationship between the two quantities:
I’ve used Lanphear’s data in my model, since the vast majority of children in Chicago have a low, but non-zero BLL that would be poorly represented by the linear approximation.
IQ loss to disability weight
The WHO maintains a list of weights for most major health conditions as part of its Disability Adjusted Life Year (DALY) metric, used to estimate the effectiveness of health interventions. On average, one DALY represents one year of healthy life lost.
In the case of cognitive impairment due to lead exposure, the WHO lists a weight of 0.361, referencing a 1997 study from the Netherlands. The original study, however, describes a more complex relationship between IQ and disability, as shown in the table below:
| IQ low | IQ high | Weight | CI low | CI high |
|---|---|---|---|---|
| 70 | 84 | 0.090 | 0.137 | 0.040 |
| 50 | 69 | 0.286 | 0.496 | 0.091 |
| 35 | 49 | 0.430 | 0.518 | 0.353 |
| 20 | 34 | 0.820 | 0.967 | 0.673 |
| 5 | 20 | 0.760 | 0.980 | 0.534 |
For the purposes of this analysis, I fit a linear model to the Netherlands data (using the midpoint of each IQ range). The parameters of the fit are shown below:
                 coef    std err          t      P>|t|
------------------------------------------------------
const          0.9840      0.101      9.740      0.002
x1            -0.0116      0.002     -5.665      0.011
Lead poisoning in Chicago
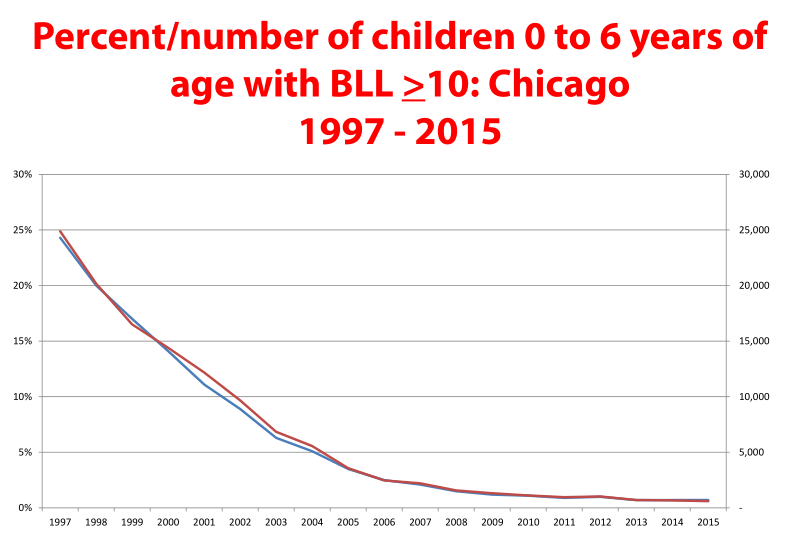
Tracking down specific, consistent numbers to estimate the distribution of BLL in Chicago proved to be a surprisingly difficult task. After pouring through city and state-level data (Illinois DPH, what’s with the 2014 numbers?), I finally found the graphs I was looking for in a 2015 presentation by Chicago’s Medical Director for Environmental Health Cort Lohff, and used WebPlotDigitizer to extract the data. The plot for BLL > 10 μg/dL is shown below:
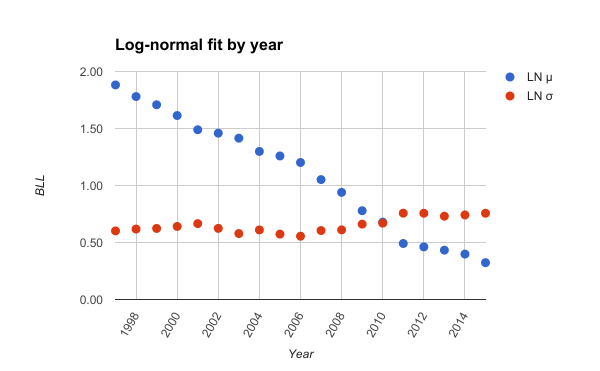
To derive the full distribution using the two given points (BLL > 5 μg/dL and BLL > 10 μg/dL for each year), I fit a log-normal curve using the Z-Scores for the respective thresholds in the normal distribution. The use of a log-normal was an educated guess (based on the prior assumption of a long right tail, and left wall at zero), but the parameters show a steadily decreasing mean and relatively constant deviation, lending some credence to the choice. Fitting the data from 1997 through 2015 produces the following yearly distribution parameters:
The whole thing
Combining all the data from above, the workflow for the cost effectiveness model is as follows:
- Generate a group of N Chicago children between the age of 0 and 6 (for reasons described in the section below, N is set to approximately 100).
- Assign each child a random age and sex, and derive their remaining actuarial life expectancy (to be used in the DALY calculation).
- Assign each child a random IQ from the standard normal distribution (100, 15).
- Determine the child’s “prior” disability weight and DALYs due to cognitive impairment unrelated to lead.
- Give each child a random BLL from Chicago’s 2015 distribution.
- Derive the child’s “expected” disability weight and DALYs using their BLL, assuming no intervention.
- Assign each child to a random house in Del Toral’s study (with a disturbed service line), and assume they are exposed to mean lead water ppb from a specific test sequence.
- Convert the ppb level into BLL using the relationship derived from Lanphear’s data, representing the portion of that child’s BLL caused by leaded water.
- Subtract this BLL from the child’s “expected” level (this optimistically assumes 100% lead reduction), and calculate the “post” IQ loss.
- Use the “post” IQ to calculate a new disability weight and DALYs.
- Subtract the “expected” from “post” DALY levels to calculate the DALYs averted due to the intervention.
For most kids chosen at random from homes with disturbed LSLs, any intervention will have little or no effect because disability weights only register at sub-100 IQ levels. As such, this estimate represents a lower bound for the true benefits of averting childhood lead poisoning, in that it ignores the negative effects of IQ loss that don’t lead to disability.
Simulating the solution
Of the plausible interventions that could reduce Chicago’s water lead exposure, I’ve highlighted what I consider to be the four most plausible below, along with pros and cons for each.
| Intervention | Pros | Cons |
|---|---|---|
| Information | Simply informing residents about their lead service lines, and the associated health risks to their kids, might be enough to convince many to take independent action. Those in wealthier communities may be amenable to the cost of replacing their LSL, and others could simply change their water habits in a way that best fits their needs/means, such as flushing their taps, and/or using bottled/filtered water. | The cost of replacing a single LSL can run upwards of $10K, putting the most sustainable solution out of the reach of many of Chicago’s poorest residents. Human beings are also notoriously bad at interacting with undetectable environmental dangers (such as CO2). |
| Flushing | Both the Department of Water Management and EPA recommend flushing your taps for about five minutes if your water has been stagnant for more than six hours. This allows for any leaded water that has accumulated in the service line to be removed from the system prior to consumption. While this does not completely remove all lead, Del Toral’s study suggests that it does reduce it to near-baseline levels for homes with recently disturbed LSLs. | It might be difficult to enforce a household flushing policy, and even perfect compliance won’t completely eliminate the risk of lead poisoning. Moreover, Lanphear’s analysis shows that the steepest drop in IQ comes at the lowest levels of BLL, meaning that it’s critical to completely eliminate lead from the supply, not just reduce it. Also, daily flushing can waste thousands of potentially potable gallons of water per house per year. |
| Bottled water | Aside from replacing an LSL, bottled water is one of the few solutions that is nominally free of lead. While small individual bottles can be expensive, dispensers which use large, recyclable jugs might be more sustainable. | Bottled water is notorious for being wasteful and expensive, and that reputation is well deserved. As with LSL replacement, this option is likely unavailable to those with the highest risk of lead poisoning. Water is also heavy and difficult to transport, part of the reason we have a municipal delivery system in the first place. |
| Filtration | Unlike bottled water, filters leverage the existing distribution infrastructure, removing any contaminants in the final step before consumption. Water filtration can also remove other harmful dissolved solids such as copper, with some filters even promising to remove all TDS (which might have additional health benefits and risks). | The useful life of a filter cartridge largely depends on TDS, and may be inefficient for some municipal supplies. Replacement cartridge costs are recurring, and could total hundreds of dollars per family per year. It might also be difficult to remember to use filtered water consistently, especially if the filtration process is inconvenient. |
Filtering Chicago’s water
Despite the limitations of water filtration, I believe it represents the most cost effective intervention for removing all the lead from Chicago’s water. A simple back-of-the-envelope calculation, shown in the table below, helps estimate the per-child cost of filter distribution.
| Parameter | Value | Description |
|---|---|---|
| Chicago TDS | 175 | Total dissolved solids in Chicago water supply |
| Gallons/filter | 27.8 | Number of gallons per filter given TDS |
| Gallons/child/day | 1.0 | How many gallons one child consumes each day (drinking + cooking) |
| Children/house | 2.5 | How many children per targeted house |
| Gallons/house/day | 2.5 | Number of gallons consumed per house each day |
| Filter days/house | 11.1 | Average filter lifespan in days |
| Days/intervention | 120 | How many days to filter water after main replacement |
| Filters/intervention | 10.8 | Number of filters required per intervention |
| Filter cost | $8.42 | Cost of each filter |
| Pitcher cost | $30.00 | Cost of each pitcher |
| Filters/pitcher | 1 | Number of included filters per pitcher |
| Cost/house | $112.42 | Total cost per house |
| Cost/child | $44.97 | Total cost per child |
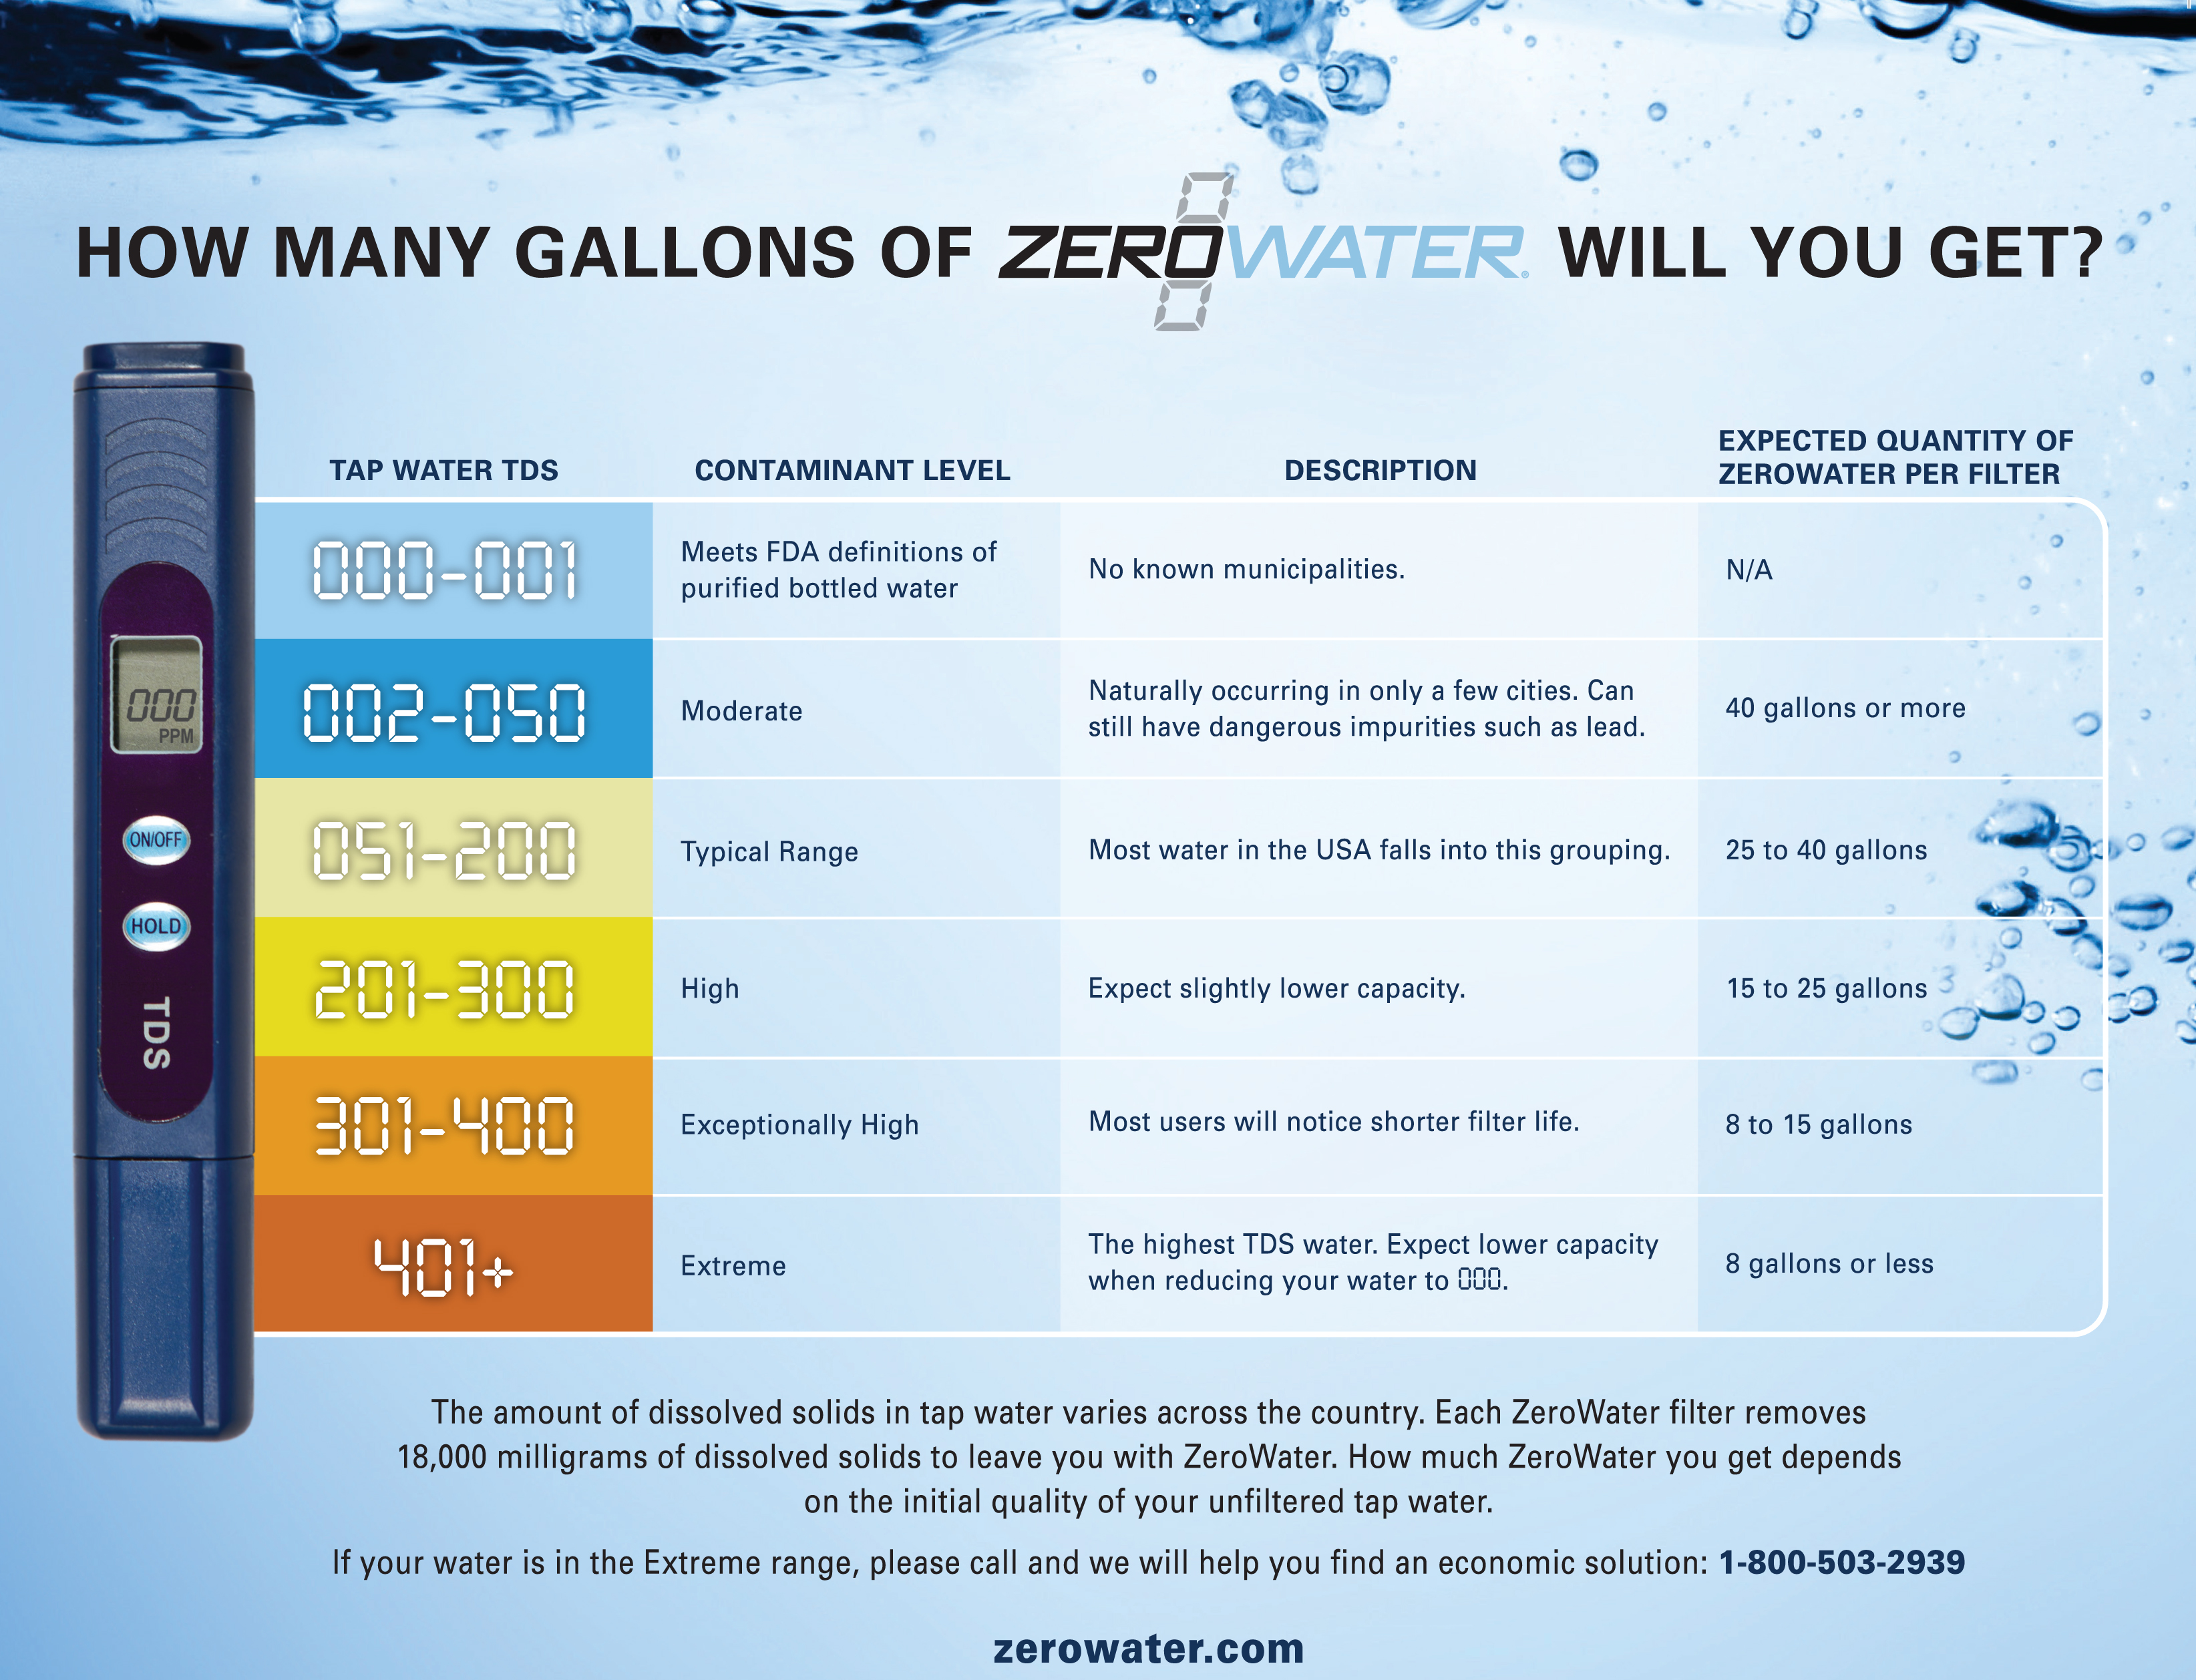
To get the filter-specific variables, I selected the ZeroWater system, apparently the least expensive lead-rated filter (see here for a list of all NSF lead-approved filters). ZeroWater also provides a handy guide estimating cartridge life at different TDS levels, shown in the image below.
Assuming that only families with kids from the age of 0 to 6 are targeted, and the filtered water is only used by the kids, there’s still the question of how many days of filtration are required to avert the negative consequences of a water main replacement. While there doesn’t seem to be a clear answer to this question, I’ve assumed that four months of filtration is sufficient for the purposes of this estimate.
The cost effectiveness of filtration
Because the model estimates the effectiveness on a per-child basis, it’s necessary to simulate a cohort of children to properly estimate the uncertainty. Assuming an initial budget of $5000, and dividing that by the cost per child estimate above, yields an average of approximately 100 children per intervention group.
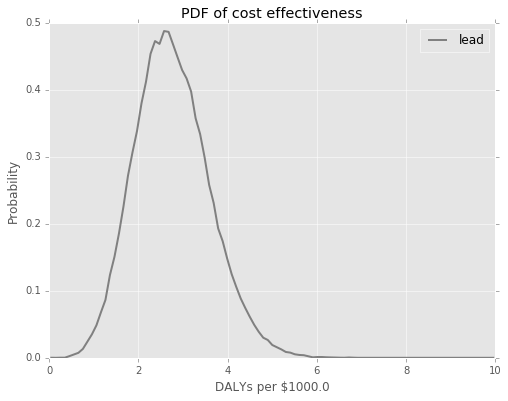
A meta-simulation of 100,000 groups results in the following probability distribution for cost effectiveness, in DALYs per $1000. As the budget (and therefore cohort size) increases, the spread of distribution would decrease, but the mean value should remain approximately the same.
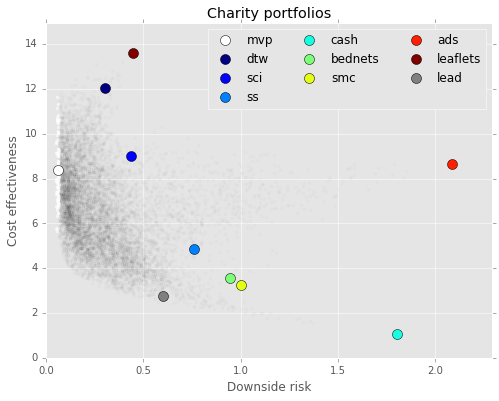
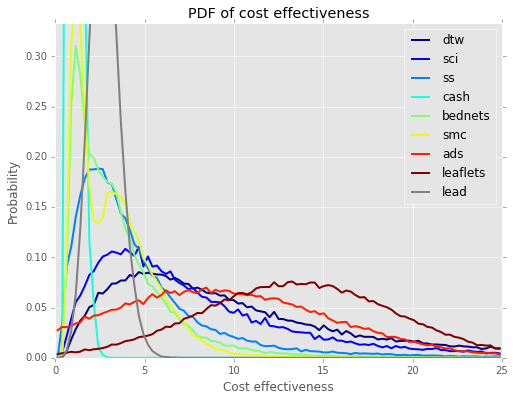
To get a feel for how well this compares with some of the gold standard interventions proposed by the Effective Altruism community, I combined the results with some of my previous work using portfolio theory to allocate donations to different effective charities:
While I’d caution against taking these results too literally, preventing lead poisoning in Chicago by filtering drinking water likely represents a low risk opportunity for donors interested in funding domestic health programs.
Future work
Tracking down information on water main replacements is not an easy task, thanks mostly to an opaque local bureaucracy. Chicago’s website listing recent water mains repairs hasn’t been updated since 2015, and a FOIA request for that data was (promptly) fulfilled not by an emailed spreadsheet, but with a CD, filled with hundreds of individual PDFs, sent by mail.
Thanks, I guess. Chicago at least does provide email alerts for water main replacements (assuming you already know the job code), which I’m planning to leverage to create water main replacement map in a future post.
In addition to filtering water in homes with recently replaced water mains, there are likely other effective ways to target those most at risk for lead poisoning. Replacing any remaining LSLs in schools, daycare facilities, community centers, etc. would be an obvious next step towards ensuring blanket coverage. I’m also excited about DSSG’s Predictive Analytics to Prevent Lead Poisoning in Children, and how it might be used to help target future water lead interventions.
