Stochastic Altruism 2016
Earlier this year I took GiveWell’s cost effectiveness estimates and ran a Monte Carlo simulation, treating the GiveWell employee rankings like independent random variables, and employing techniques from Modern Portfolio Theory to find “optimum” charity portfolios. Although I’ve been planning to use this method to inform my year-end giving, I wanted to wait to see if there were any substantive updates in GiveWell’s December rankings, and I’m glad I did.
- Stochastic altruism 101
- GiveWell’s new numbers
- Why I mostly believe in worms too, I guess
- What happened to iodine?
- 2016 giving summary
Stochastic altruism 101
Most of the specifics are now outdated, but it might still be worth reviewing the original post on stochastic altruism for details on how the algorithm works. The basic steps haven’t changed:
- Import GiveWell data, treating all input parameters as random variables.
- Run a Monte Carlo simulation on the ensuing calculations, logging cost effectiveness on each simulation.
- Create random charity portfolios using cost effectiveness data.
- Use Modern Portfolio Theory to analyze portfolios.
- ?
- Nonprofit
The source code for the whole process is available here.
GiveWell’s new numbers
In there December 2016 update, GiveWell introduced several new organizations to its “Top Charities” list; Malaria Consortium, END Fund, and Sightsavers. These nonprofits, along with those carried over from previous recommendations, fall into one of three main categories.
| Category | Charities |
|---|---|
| Malaria | Against Malaria Foundation, Malaria Consortium |
| Deworming | Schistosomiasis Control Initiative, Deworm the World Initiative, END Fund, Sightsavers |
| Cash Transfers | GiveDirectly (Basic Income) |
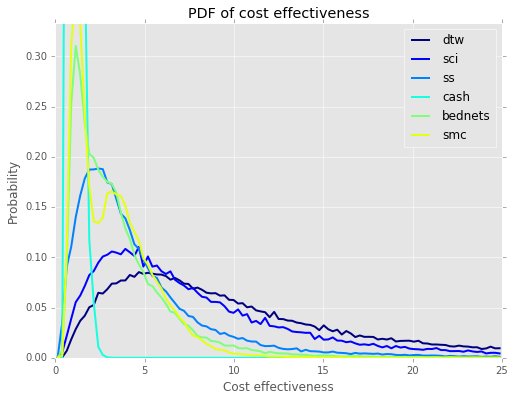
After updating the code to match GiveWell’s new calculation spreadsheet, I added a new category for each charity, “DALYs per $1000”, a necessary inversion of “Cost per equivalent life saved” because the MPT, like everything else, assumes that bigger is better. The simulation produces probability distributions for each charity/intervention as shown on the following graph:
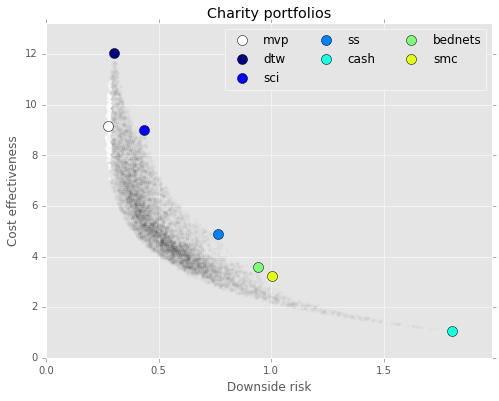
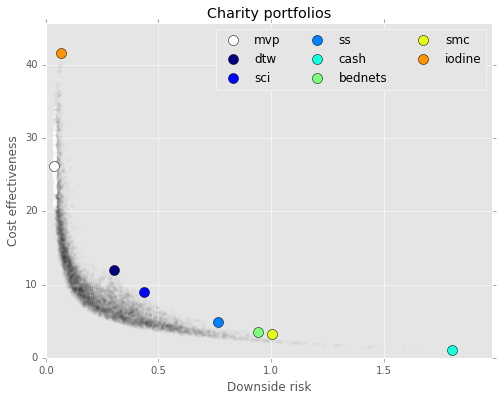
Cash, bednets (AMF), and smc (Malaria Consortium) are all grouped relatively tightly on the left, while the three deworming charities have more spread to the right. Running this data through the portfolio calculations, with downside risk calibrated to the median AMF cost effectiveness (as GiveWell’s #1 recommendation) produces this lovely Markowitz bullet:
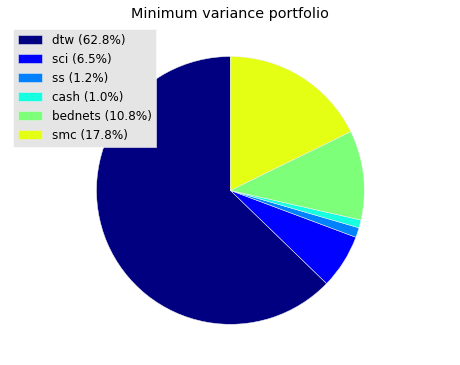
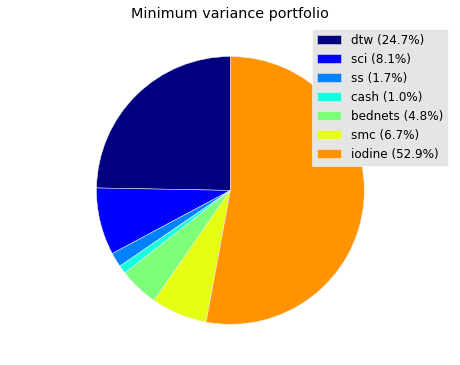
Although the exact shape of this plot is highly influenced by the value chosen for downside risk, the conclusion remains mostly the same: deworming charities have the highest upside with the lowest risk. Looking at the minimum variance portfolio (mvp), the combination of charities with the lowest downside risk, shows another interesting characteristic of GiveWell’s estimates:
Because all the deworming charities depend on many of the same parameters, and are therefore highly correlated with each other (see table below), a portfolio spreading donations across several of them does not reduce overall risk.
           dtw    sci     ss   cash  bednets    smc
dtw      1.000  0.780  0.795  0.319    0.414  0.269
sci      0.780  1.000  0.792  0.318    0.407  0.266
ss       0.795  0.792  1.000  0.324    0.418  0.274
cash     0.319  0.318  0.324  1.000    0.168  0.107
bednets  0.414  0.407  0.418  0.168    1.000  0.140
smc      0.269  0.266  0.274  0.107    0.140  1.000
Instead, the portfolio with minimum risk includes both bednets and smc, two relatively uncorrelated alternatives, which do reduce risk (at the expense of expected effectiveness).
Why I mostly believe in worms too, I guess
I don’t really have a strong (or informed) opinion about deworming in general, or the Worm Wars specifically, but I recently read David Roodman’s thorough post on the subject, and I’m cautiously persuaded by his conclusions. To summarize the whole thing as succinctly as I can:
- Hundreds of millions of children worldwide suffer from parasitic worms, most commonly hookworm, roundworm, whipworm, and schistosomiasis.
- These infections commonly result in abdominal illness, impaired cognition, and delayed development.
- Ted Miguel and Michel Kremer wrote a groundbreaking paper on mass deworming in Kenya in the late 90s.
- The results of their study showed that childern who received the treatment, and even those at the same school who did not, attended school more often.
- A follow-up paper by Sarah Baird and Joan Hamory Hicks studied these same children a decade later.
- They found that the original treatment group had a significantly and substantially larger income than the control group.
- However, an analysis by Cochrane Review found that mass deworming “does not improve average nutritional status, haemoglobin, cognition, school performance, or survival”.
- (However)2, Roodman points out that Cochrane Review focused on problems in the original study from an epidemiological perspective, while a closer analysis of the of the data with these limitations in mind does not change the original conclusions.
This isn’t exactly a slam dunk, but even with conservative estimates for replicability, deworming still rates as the most cost effective category that GiveWell considered in 2016.
What happened to iodine?
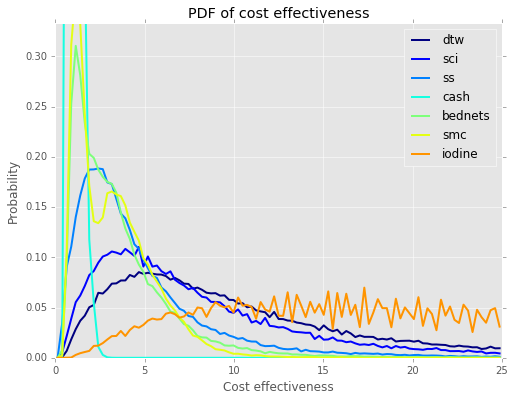
Iodine disappeared from this round of GiveWell cost effectiveness calculations, even though the GAIN and IGN still are still listed as charities “Worthy of Special Recognition”. This is a bit of a disappointment, since salt iodization programs graded out so well in their mid-year review. While I haven’t seen any direct explanation for the removal, I assume the decision to prioritize other interventions was made for good reason. Still, I was curious how iodine would look relative to the new analysis, so I updated the previous calculations to factor in the latest shared parameters, and redid the above analysis, with the following results:
Obviously this would be a big deal, if accurate. One major caveat is that the estimates for the iodine-specific parameters are out of date, and likely don’t reflect the most recent analysis. Still, the magnitude of the difference is worth considering: iodine grades out as both the most cost effective and least risky intervention, and it isn’t really close. Still, I’m heavily discounting this conclusion for now, pending an explanation from GiveWell.
2016 giving summary
I’ve followed GiveWell’s recommendations pretty closely in recent years, and I mostly plan to continue that trend. While I’m persuaded that deworming represents a high risk/reward opportunity for cost effectiveness, I believe that, like with any investment, a diversified portfolio is normally the best option, and in the case of charitable giving, will do the most good. Here’s the breakdown of my 2016 giving plan:
| Charity | % |
|---|---|
| Deworm the World Initiative | 30% |
| Against Malaria Foundation | 25% |
| GiveDirectly (half for UBI) | 20% |
| Malaria Consortium | 10% |
| Global Alliance for Improved Nutrition | 5% |
| Iodine Global Network | 5% |
| Animal Charity Evaluators Recommendation | 5% |
The final 5% allocated to Animal Charity Evaluators will be covered in follow-up post, where I’ll try my hand at cross-species cost effectiveness by merging their calculations with GiveWell’s. Stay tuned.
